Blog Lithium Battery-school
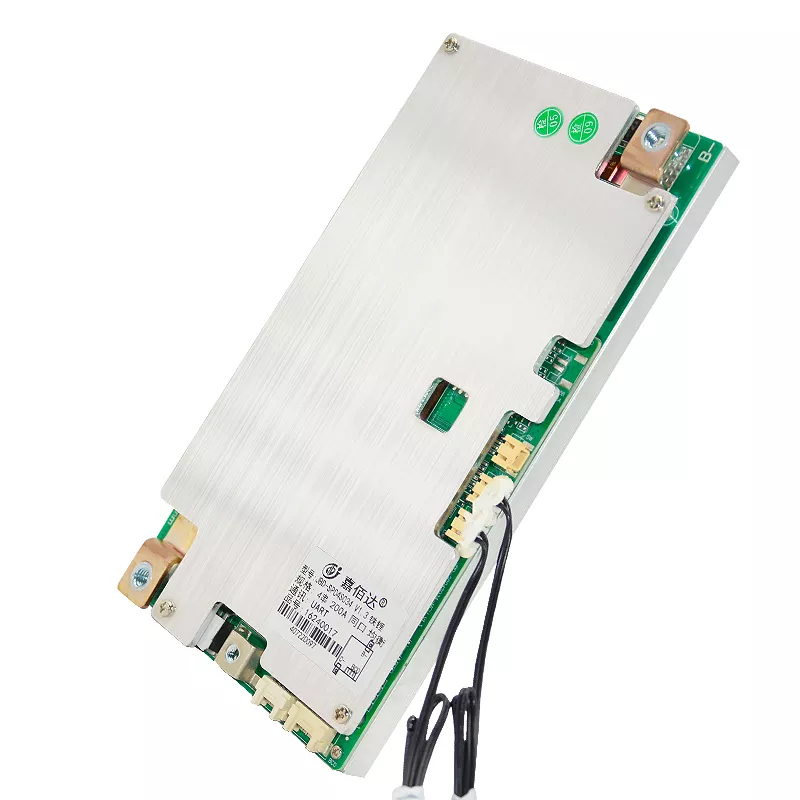
How to Start a JK BMS (4-8S) for the First Time – 4S (12V) Setup

If the JK BMS is not turning on when first connected, follow these steps to troubleshoot and properly power it up.

1. Check the Wiring Connections

  • Ensure the balance leads are connected correctly
    • The B- lead should be connected to the main negative of the battery pack.
    • The balance wires must be connected in the correct sequence:
      • B0 (Black wire) → Main negative terminal of the first cell
      • B1 → Positive terminal of Cell 1
      • B2 → Positive terminal of Cell 2
      • B3 → Positive terminal of Cell 3
      • B4 → Main positive terminal of the battery pack

2. Verify Cell Voltages

  • Measure the voltage between each balance wire using a multimeter.
  • Ensure all cell voltages are within a reasonable range (typically 3.2V – 3.6V per cell).
  • If any cell voltage is missing or significantly different, the BMS may not power on.

3. Check the Main Power Connection

  • B- Wire (Main Negative): Ensure the thick B- wire is securely connected to the main negative of the battery pack.
  • P- Wire (Output Negative): This connects to the load/charger and should not be used for powering the BMS initially.

4. Manually Activate the BMS

  • Some JK BMS units require manual activation if they don’t turn on automatically.
    • Try plugging in a charger (even briefly) to the battery terminals to “wake up” the BMS.
    • Alternatively, hold down the power/reset button (if available) for 3-5 seconds.
    • If you dont have the power button, consider sourcing one

5. Check if the BMS is Drawing Current

  • Use a multimeter in DC current mode to check if any current is flowing through the BMS.
  • If the BMS is drawing zero current, it may indicate a wiring issue or a defective unit.

6. Test Communication with the App

  • Download the JK BMS App on a smartphone.
  • Turn on Bluetooth and try scanning for the device.
  • If the BMS does not appear, it is still off or not receiving power.

7. Inspect for Factory Sleep Mode

  • Some BMS units are shipped in a factory sleep mode, requiring a charger or an external power source to turn on.

8. Reset the BMS

  • If all else fails, disconnect all connections for 1-2 minutes, then reconnect everything carefully.

Final Check

  • Once the BMS powers on, verify that all cell voltages are detected correctly in the app.
  • If issues persist, check the BMS documentation or test with another BMS to rule out a faulty unit.

STILL NOT WORKING? Its probably in sleep mode

If the JK BMS is in sleep mode and does not have a power button, here are all possible ways to wake it up:


1. Connect a Charger to the Battery

  • Most common method: Connecting a charger to the battery terminals will usually wake up the BMS.
  • Plug a LiFePO4-compatible charger (or a power supply) into the battery’s main terminals (B+ and B-).
  • Even a brief connection (a few seconds) might be enough to turn the BMS on.

2. Connect a Charger to the Load Side (P+ and P-)

  • If charging via the battery terminals does not work, try connecting the charger to the load terminals (P+ and P-).
  • Some JK BMS models wake up when voltage is applied here.

3. Apply a Small Load Across P+ and P-

  • Some JK BMS units wake up when they detect a current draw.
  • Connect a small 12V load (e.g., a 12V light bulb or small resistor) across P+ and P- for a few seconds.

4. Jumpstart the BMS Using a Resistor or Wire

  • Take a resistor (~1kΩ – 10kΩ, 0.5W or higher) or a jumper wire and temporarily connect:
    • B+ (battery positive) to P+ (load positive)
    • B- (battery negative) to P- (load negative)
  • This creates a tiny voltage differential, which can wake the BMS up.

5. Disconnect and Reconnect the Balance Leads

  • Sometimes, disconnecting and then reconnecting the balance leads (B0-B4) in the correct order can trigger the BMS to power on.
  • Steps:
    1. Disconnect the balance connector from the BMS.
    2. Wait 1-2 minutes.
    3. Reconnect it in the correct sequence (B0 → B1 → B2 → B3 → B4).

6. Use a Bench Power Supply to Apply Voltage to B+ and B-

  • If the BMS is completely unresponsive, try applying a small amount of voltage from a bench power supply.
  • Set the power supply to 12-14V, and briefly connect it to B+ and B-.
  • This simulates a charger and can often wake up the BMS.

7. Check for a Reset Pin on the BMS Board

  • Some JK BMS units have an internal reset pin or pads that, when shorted for a second, will wake the unit.
  • If comfortable opening the BMS case, check for labeled pads (like RST or SW) and try shorting them momentarily.

Final Step: Replace the BMS

If none of these methods work, the BMS might be defective or damaged. Testing with another BMS will confirm whether the issue is with the battery or the unit itself.

News Manufacturers
Comprehensive Guide to Battery Management Systems (BMS): Comparing JBD, JK, PACE, Daly, and More

In today’s rapidly expanding energy storage market, Battery Management Systems (BMS) play a critical role in the health, safety, and performance of lithium batteries. Whether you are building a battery for a solar setup, electric vehicle (EV), or DIY energy storage system, choosing the right BMS is essential for managing battery performance, extending lifespan, and protecting against potential hazards.

This guide will delve into some of the most popular and well-regarded BMS options available in the market, including JBD, JK, and Daly, analyzing their features, reliability, and overall performance. We’ll also highlight the pros and cons of each system to help you make an informed decision based on your specific requirements.

What is a Battery Management System (BMS)?

A BMS is an electronic system that manages a rechargeable battery, such as lithium-ion or lithium iron phosphate (LiFePO4), by controlling key functions like charging, discharging, temperature, and overall safety. The BMS ensures that the battery operates within safe limits and helps prolong its lifespan by balancing the cells and protecting against issues like overvoltage, undervoltage, and overheating.

Popular BMS Brands Overview

The BMS market is vast, with many different manufacturers offering various models ranging from budget-friendly basic protection systems to advanced smart BMS options with sophisticated features like Bluetooth connectivity and active balancing. Let’s explore some of the most popular brands:


1. JBD BMS (Jiabaida BMS)

Overview:
JBD is a popular choice among DIY battery builders and professionals alike. Known for its reliability and affordability, JBD offers a wide range of BMS products suitable for everything from small battery packs to large energy storage systems. It also features smart BMS options with Bluetooth, providing real-time monitoring and control through mobile apps.

Support for Victron, DEYE, Growatt and many other inverters.

Key Features:

  • Available in 12.8V to 48V(51.2V) configurations, with various amp ratings.
  • Both Smart BMS with Bluetooth connectivity for monitoring battery status via an app and Regular BMS, set and forget!
  • Robust passive and active balancing models to keep cell voltages even.
  • Comprehensive protection against overcharge, over-discharge, and over-temperature.
  • Configurable parameters via PC software or mobile app.

Pros:

  • Cost-effective with very reliable performance.
  • Smart features like Bluetooth monitoring and mobile app control.
  • Flexible configuration options.
    Excellent Accuracy for SOC calculations
  • Available in high current ratings, suitable for large packs.
  • Regular firmware updates improve functionality.

Cons:

  • Slightly more complex to set up compared to simpler BMS units.
  • Bluetooth connection range can be limited.
  • Lack of detailed user manual support for first-time users.

Best For:
JBD BMS is well-suited for both DIY enthusiasts and professional battery builders who need reliable, affordable BMS with smart monitoring features. Ideal for medium to large battery packs in solar, RV, and EV applications.


2. JK BMS (JiKong BMS)

Overview:
JK BMS is one of the most advanced BMS systems on the market, especially popular among energy storage professionals. It is known for its robust features, including active balancing, high customization options, and detailed data monitoring. JK BMS is highly regarded for its accuracy, durability, and flexibility, making it ideal for large-scale and critical battery systems. Support for Victron, DEYE, Growatt and many other inverters.

Key Features:

  • Active balancing (dynamic cell balancing) ensures cells are equalized during operation.
  • Bluetooth connectivity for real-time monitoring via a mobile app.
  • Configurable protection parameters for precise control over charging and discharging.
  • Software is good, but not perfect, and support has been poor in 2024 for the new model

Pros:

  • Excellent active balancing capabilities reduce cell degradation and extend lifespan.
  • Detailed monitoring and data logging for precise control.
  • Widely customizable for different applications off-grid systems, and commercial setups.
  • Rugged design with high current and voltage tolerance.
  • Good accuracy for professional energy storage projects.

Cons:

  • More expensive than basic BMS units.
  • Higher learning curve for those new to BMS systems.
  • Requires more time to set up and configure.
  • Quality of materials may be lower, than JBD
  • Software has been buggy.

Best For:
JK BMS is the go-to choice for large-scale, critical energy storage applications where active balancing and precise control are necessary. It is ideal for professional setups, commercial energy storage, and high-performance EVs.


3. Daly BMS

Overview:
Daly BMS is another popular option, especially in the DIY space, due to its affordability and basic functionality. Daly BMS is often used for simple battery systems that don’t require the advanced features seen in more expensive systems like JK or JBD. It offers basic protection for lithium batteries, making it suitable for small energy storage systems or low-demand applications.

Key Features:

  • Basic protection: overvoltage, undervoltage, over-temperature, and short circuit protection.
  • Available in 12V to 48V configurations with various amp ratings.
  • Passive balancing for maintaining cell voltage consistency.
  • Compact design, easy to install, and cost-effective.

Pros:

  • Easy to buy
  • Simple to set up and use.
  • Basic cell balancing and protection features are sufficient for smaller setups.
  • Widely available with many options for different voltage and current requirements.

Cons:

  • Passive balancing is less efficient than active balancing.
  • Less suitable for large or high-performance battery systems.
  • Durability concerns for long-term use in critical applications.
  • Active Cooling is unreliable

Best For:
Daly BMS is ideal for small-scale projects, DIY enthusiasts, and applications where basic protection is sufficient, such as small solar setups, electric bikes, or RVs. However, it may not be the best choice for large or critical energy storage projects.

4. PACE BMS

PACE BMS is designed to offer precise control and management over battery packs, particularly in scenarios where safety, durability, and advanced functionality are critical. It competes with other high-end BMS solutions like JK and REC, offering features that cater to both small and large battery systems. The focus is often on high voltage and high current capabilities, active balancing, and detailed monitoring.

PACE BMS is trusted in many server rack batteries, and is very similar to many other professional grade UPS and ESS storage BMS, with communication with Inverters and other parallel batteries one of the strengths of this product. Support for Victron, DEYE, Growatt and many other inverters.

Key Features of PACE BMS:

  • Passive Balancing: Ensures cells within the battery pack remain balanced, improving the pack’s longevity and performance.
  • High Voltage and Current Support: PACE BMS is designed to handle larger battery packs, making it suitable for industrial energy storage systems and EVs.
  • Smart Monitoring: Bluetooth connectivity, Wi-Fi integration, and real-time monitoring through mobile apps and dedicated displays.
  • Scalability: PACE BMS supports a wide range of voltages and capacities, making it versatile for projects of various sizes.
  • CAN Communication: Allows integration into more complex systems and communication with other components, such as in electric vehicles or sophisticated solar setups.
  • Configurable Protection Settings: Advanced protection for overvoltage, undervoltage, over-temperature, and current surges, with configurable thresholds.

Pros of PACE BMS:

  • Advanced Features: PACE BMS offers high-end features like balancing, real-time monitoring, and CAN communication, making it suitable for professional or industrial-grade systems.
  • High Reliability: It is built with a focus on safety and durability, ensuring optimal performance even under demanding conditions.
  • Great Scalability: Suitable for both small and large battery packs, offering flexibility across different applications.
  • Detailed Monitoring: Real-time feedback on battery health and performance ensures better maintenance and control.

Cons of PACE BMS:

  • Higher Cost: PACE BMS tends to be on the more expensive side compared to options like Daly or JBD, which may not make it ideal for DIY enthusiasts or small-scale projects.
  • Complexity: Due to its advanced features and configuration options, PACE BMS has a steeper learning curve and may require technical knowledge to set up and manage effectively.
  • Overkill for Simple Systems: For small or low-demand projects, PACE BMS may offer more features than necessary, which could result in unnecessary costs.

Best For:

PACE BMS is ideal for large, complex energy storage systems, electric vehicles, or any application that demands high reliability, precision, and detailed monitoring. Its advanced features and robust safety mechanisms make it a top choice for critical systems where performance and safety are paramount.


5. Other Popular BMS Options

Overkill Solar BMS:
Specifically designed for DIY solar energy storage systems, Overkill Solar BMS is known for its user-friendly interface and detailed monitoring features. It offers Bluetooth connectivity and a built-in display for real-time stats, making it a favorite among home solar system installers. Overkill uses modified versions of the JDB BMS, in some cases the same BMS.

REC BMS:
One of the high-end options, REC BMS, is designed for advanced applications requiring detailed control, real-time data, and integration into large, complex systems. It supports both passive and active balancing and is highly customizable, often used in commercial energy storage projects.


Pros and Cons Comparison Table

BMS BrandKey FeaturesProsConsBest For
JBDSmart BMS, Bluetooth, balancing, overcharge/over-temp protectionCost-effective, smart features, reliable performanceComplex setup, low balance currentsDIY and professional setups for solar, EVs, and large battery packs
JKActive balancing, high current, customizable parametersHigh current Active balancing, touchscreen, BluetoothExpensive, steep learning curve, software issuesSmall-scale energy storage, EVs, commercial energy applications
DalyBasic protection, passive balancing, over-voltage/under-voltageEasy to buy, easy to use, basic protectionLacks advanced features, limited balancing capabilitiesSmall DIY projects, basic solar setups, electric bikes
PACEBluetooth, passive balancing, over-temperature protectionHigh price, difficult setup, Bluetooth monitoringLacks advanced features like active balancing, not DIY friendlyCommercial scale solar setups, low-voltage energy storage systems
RECActive balancing, high customization, detailed monitoringHighly customizable, integrates into large systems, active balancingVery expensive, complicated setup
overly complex
Large commercial projects, grid-connected systems, high-end EV setups

Final Thoughts: Which BMS is Right for You?

When it comes to selecting a BMS, the right choice depends on your specific project requirements. Here’s a quick summary to help guide your decision:

  • For DIY enthusiasts or small battery systems: JBD offers the most budget-friendly option with basic protection features. It’s ideal for simple projects like e-bikes or small solar setups.
  • For advanced DIY and professional setups: JBD and JK BMS is a great middle-ground option, providing smart features like Bluetooth monitoring, good balancing, and flexibility in configuration. It’s a solid choice for medium to large battery packs.
  • For large-scale or critical energy storage systems: PACE BMS is the gold standard, offering active balancing, high current handling, and extensive monitoring capabilities. It’s perfect for large energy storage projects, EVs, and commercial applications where reliability and performance are paramount.

Ultimately, the best BMS for your needs will depend on the complexity and scale of your project, as well as your budget. Each BMS option has its strengths, and understanding your specific requirements will help you choose the most suitable one for your system.


Ready to Take Your Energy Storage to the Next Level?

At LiFePO4 Australia, we specialize in helping you choose the best components for your battery systems. Whether you’re looking for a high-end BMS or just starting out with a basic battery pack, we’ve got you covered with expert advice and top-tier products. Contact us today to learn more about our range of BMS options and how we can help you build the perfect battery system!

News
Safe Installation of LiFePo4 Batteries in Australia

AS/NZS 5139-2019 Compliance Guide for a 15kWh, 51.2V, 300Ah Lithium Battery with LiFePO4 Cells

All of our LiFePro Batteries are designed to comply with IEC62619 for installation to AS/NZS3001.2:2022 standard. Our Lithium batteries are designed to comply to IEC62619 and therefore can usually be installed in most applications.
We are currently working on the application and certificate of IEC62619 for a number of our batteries. You can reach out to find out more by calling us on (07) 4191 6815

Compliance vs. Certification

Compliance:

  • When a battery complies with IEC 62619, it means that the battery has been designed and manufactured to meet the requirements and criteria set out in the IEC 62619 standard.
  • This compliance could be based on internal testing and assessments conducted by the manufacturer to ensure that the battery meets the necessary safety and performance specifications outlined in the standard.

Certification:

  • Certification, on the other hand, involves a formal process where an accredited third-party testing organization tests and verifies that the battery meets the IEC 62619 standard.
  • This process includes rigorous testing under controlled conditions and results in an official certificate or mark that indicates the battery has been independently verified to meet the standard.
  • Certification provides a higher level of assurance and credibility to customers and regulators, as it involves independent validation.

Why Certification Matters

  • Market Acceptance: Many markets, industries, and customers require certified products to ensure safety and reliability. Certification can be a requirement for selling products in certain regions or for use in specific applications.
  • Liability and Compliance: Certification can protect against liability and regulatory issues, as it demonstrates that the product has been independently verified to meet recognized safety standards.
  • Customer Confidence: Certification provides customers with confidence in the quality and safety of the product, which can be a key differentiator in the market.

1. Introduction

AS/NZS 5139:2019 sets the standards for the safe installation of battery energy storage systems (BESS) in Australia and New Zealand. Compliance with this standard ensures the safety and reliability of your lithium battery system. This guide will help you meet these standards for your 15kWh, 51.2V, 300Ah lithium battery containing LiFePO4 cells. To ensure the safety and compliance of your 15kWh, 51.2V, 300Ah lithium battery system, it’s important to adhere to both AS/NZS 5139:2019 and additional regulations specified in AS/NZS 3000:2018

2. System Design

2.1 Battery Specification

  • Capacity: 15kWh
  • Voltage: 51.2V
  • Current: 300Ah
  • Chemistry: Lithium Iron Phosphate (LiFePO4)

2.2 Key Components

  • Battery Management System (BMS)
  • Inverter/Charger
  • Safety Enclosure
  • Circuit Protection Devices (Fuses/Breakers)
  • Cabling and Connectors

3. Installation Site Requirements

3.1 Location

  • Battery Location & Restrictions:
  • Install the battery system in a well-ventilated, cool, and dry area.
  • Avoid direct sunlight and ensure the location is away from flammable materials.
  • Batteries cannot be installed in restricted locations such as near gas appliances and gas cylinders. Specifically, there are exclusion zones for electrical installations near gas relief vent terminals to prevent ignition hazards (AS/NZS 3000:2018, Section 4.18)​ (GSES)​.
  • Ventilation and Environmental Requirements:
  • Ensure the installation site provides adequate ventilation to avoid overheating and accumulation of gases. The location should maintain temperatures within the limits specified by the manufacturer and control humidity levels to prevent condensation​ (Standards.govt.nz)​​ (GSES)​.

3.2 Access and Clearances

  • Ensure clearances around the battery system for maintenance and ventilation as specified by the manufacturer.
  • Allow at least 600mm clearance around the battery enclosure.

3.3 Environmental Conditions

  • Install the system within the environmental conditions specified by the manufacturer (e.g., temperature, humidity).

4. Safety Considerations

4.1 Battery Enclosure

  • Use a non-combustible, weatherproof enclosure with an IP rating appropriate for the installation location (e.g., IP65 for outdoor installations).
  • The enclosure should have ventilation to prevent the accumulation of gases.

4.2 Fire Safety

  • Install fire-resistant barriers as required.
  • Maintain a safe distance from ignition sources.
  • Ensure the system is equipped with a fire suppression system if required by local regulations.
  • Fire Safety and Hazard Protection:
  • Install fire-resistant barriers and maintain safe distances from potential ignition sources. A fire suppression system may be required depending on local regulations​ (Smart Energy Council)​(GSES)​.

4.3 Emergency Shutdown

  • Provide an accessible emergency shutdown switch.
  • Ensure clear labeling and instructions for emergency procedures.
  • Documentation should include detailed installation, operation, and maintenance instructions, along with clear labeling for emergency shutdown procedures​ (Standards.govt.nz)​​ (Clean Energy Council)​.

5. Electrical Installation

5.1 Circuit Protection

  • Install DC fuses or circuit breakers appropriately rated for your battery system to protect against overcurrent conditions. Proper cable sizing is essential to minimize voltage drop and prevent overheating​ (Standards.govt.nz)​​ (GSES)​.

5.2 Cabling

  • Use cables rated for the maximum current and voltage of the battery system.
  • Ensure cables are correctly sized to minimize voltage drop and heat generation.
  • Secure and protect cables against physical damage.

5.3 Earthing and Bonding

  • Earth the battery system according to AS/NZS 3000:2018.
  • Ensure all metallic parts are bonded to prevent electrical shock hazards.

5.4 Inverter/Charger Integration

  • Connect the battery system to the inverter/charger according to the manufacturer’s instructions.
  • Ensure the inverter/charger is compatible with the battery’s voltage and current specifications.

6. Battery Management System (BMS)

6.1 Functions

  • Overcharge/Over-discharge Protection: The BMS monitors the state of charge and prevents the batteries from being overcharged or excessively discharged, which can damage the cells and reduce their lifespan.
  • Temperature Monitoring and Control: The BMS tracks the temperature of the cells and the environment to prevent overheating. It can shut down the system or reduce the charge/discharge rates if temperatures exceed safe levels.
  • Cell Balancing: The BMS ensures that all cells in the battery pack are charged equally, preventing any single cell from becoming a weak link and reducing the overall capacity and lifespan of the battery.
  • Communication: The BMS communicates with external systems like the inverter/charger to provide status updates, alerts, and control signals.
  • Sound Alarm: The BMS must be equipped with an audible alarm to alert users in case of critical issues such as overcharge, over-discharge, overheating, or any other condition that might lead to a hazardous situation. This is part of ensuring that the system can provide immediate alerts to prevent accidents and enable timely intervention.

6.2 Installation

  • Manufacturer’s Instructions: Follow the specific installation instructions provided by the BMS manufacturer. This includes wiring, sensor placement, and configuration settings.
  • Configuration: Set up the BMS to match the parameters of your battery system. This might involve setting voltage thresholds, temperature limits, and other protective settings.

7. Documentation and Labeling

7.1 User Manual

  • Provide a detailed user manual including installation, operation, and maintenance instructions.

7.2 Labels

  • Clearly label the battery system with the following information:
    • Manufacturer name and contact details
    • Model and serial number
    • Electrical ratings (voltage, current, capacity)
    • Safety warnings and emergency shutdown instructions

8. Testing and Commissioning

8. Testing and Commissioning

8.1 Pre-Installation Testing

  • Component Testing: Before installing, test each component (battery cells, BMS, inverter/charger, etc.) to ensure they are functioning correctly. This includes checking for proper voltage, current, and any manufacturer-specific tests.

8.2 Post-Installation Testing

  • Inspection: After installation, perform a thorough inspection to ensure all components are correctly installed, all connections are secure, and there are no signs of damage.
  • Continuity and Insulation Tests: These tests check that the electrical connections are correct and that there are no unintended paths for current that could cause short circuits.
  • Functional Tests: Verify that the BMS and protective devices (fuses/breakers) operate correctly. Simulate fault conditions to ensure they respond appropriately.
  • Inverter/Charger Operation: Check that the inverter/charger correctly charges and discharges the battery and that it communicates effectively with the BMS.

9. Maintenance and Monitoring

9.1 Regular Inspections

  • Conduct regular inspections to ensure the system remains in good condition.
  • Check for signs of wear, corrosion, or damage.

9.2 Monitoring

  • Use monitoring systems to keep track of battery performance and health.
  • Regularly check BMS data for any anomalies or alerts.

10. Compliance and Certification

10.1 Certification

  • Obtain certification from a qualified electrical inspector to ensure the installation complies with AS/NZS 5139:2019.

10.2 Documentation

  • Keep records of all installation, testing, and maintenance activities.
  • Ensure all documentation is available for inspection by regulatory authorities.

Blog Lithium Battery-school
Lifepo4 (Lithium) vs Lead-Acid

If you are looking for a reliable and efficient energy storage solution you might be wondering whether to choose lifepo4 or lead-acid batteries. Both types of batteries have their advantages and disadvantages, depending on your needs and preferences. In this article, we will compare lithium and lead-acid batteries in terms of performance, durability, cost, and environmental impact, to help you make an informed decision.

Performance

One of the most important factors to consider when choosing a battery is its performance, which includes its capacity, power, efficiency, and lifespan.

Capacity

The capacity of a battery is the amount of energy it can store and deliver. It is measured in amp-hours (Ah) or watt-hours (Wh). The higher the capacity, the longer the battery can run your appliances and devices.

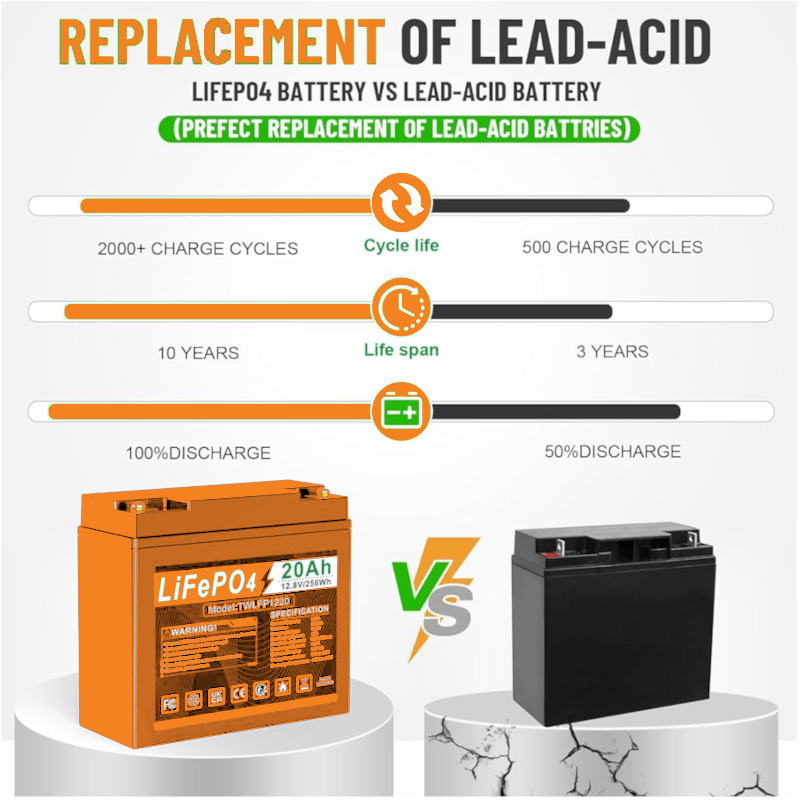
Lithium batteries have a higher capacity than lead-acid batteries of the same size and weight. For example, a 100Ah lithium battery can provide 100Ah of usable energy, while a 100Ah lead-acid battery can only provide 50Ah of usable energy at best. This is because lithium batteries can be discharged up to 100% depth of discharge (DoD), while lead-acid batteries should not be discharged below 50% DoD to avoid damaging the cells.

Power

The power of a battery is the rate at which it can deliver energy. It is measured in watts (W) or amps (A). The higher the power, the faster the battery can charge and discharge, and the more appliances and devices it can run simultaneously.

Lithium batteries have a higher power than lead-acid batteries of the same capacity. For example, a 100Ah lithium battery can deliver up to 200A of continuous current, while a 100Ah lead-acid battery can only deliver up to 100A of continuous current. This is because lithium batteries have a lower internal resistance than lead-acid batteries, which means they can handle higher currents without overheating or losing efficiency.

Efficiency

The efficiency of a battery is the ratio of the energy output to the energy input. It is expressed as a percentage (%). The higher the efficiency, the less energy is wasted during charging and discharging.

Lithium batteries have a higher efficiency than lead-acid batteries. For example, a lithium battery can have an efficiency of up to 98%, while a lead-acid battery can have an efficiency of around 80%. This means that lithium batteries can store and deliver more energy from the same amount of solar input or generator output than lead-acid batteries.

Lifespan

The lifespan of a battery is the number of charge and discharge cycles it can undergo before its capacity drops below 80% of its original value. The higher the lifespan, the longer the battery can serve you before needing replacement.

Lithium batteries have a longer lifespan than lead-acid batteries. For example, a lithium battery can last up to 2000 cycles at 100% DoD, while a lead-acid battery can last up to 600 cycles at 50% DoD. This means that lithium batteries can endure more frequent and deeper cycling than lead-acid batteries without losing much capacity.

Durability

Another factor to consider when choosing a battery is its durability, which includes its resistance to temperature, vibration, and corrosion.

Temperature

The temperature of the environment where the battery is installed and operated can affect its performance and lifespan. Extreme temperatures can cause thermal stress, expansion, contraction, and chemical reactions that can damage the cells.

Lithium batteries are more resistant to temperature than lead-acid batteries. For example, lithium batteries can operate in a wider temperature range than lead-acid batteries, from -20°C to +60°C. They also have built-in battery management systems (BMS) that monitor and regulate the temperature of each cell to prevent overheating or freezing. Lead-acid batteries are more sensitive to temperature changes and require more ventilation and insulation to maintain optimal performance.

Vibration

The vibration of the vehicle or vessel where the battery is installed and operated can also affect its performance and lifespan. Excessive vibration can cause physical damage, loose connections, and internal short circuits that can reduce the capacity and power of the battery.

Lithium batteries are more resistant to vibration than lead-acid batteries. For example, lithium batteries are made of solid-state cells that are tightly packed and sealed in sturdy cases that prevent movement and leakage. They also have BMS that protect them from short circuits and overloads. Lead-acid batteries are made of liquid electrolyte and plates that are prone to spilling and sulfation under vibration.

Corrosion

The corrosion of the terminals and connectors of the battery can also affect its performance and lifespan. Corrosion can cause increased resistance, reduced conductivity, and poor contact that can reduce the capacity and power of the battery.

Lithium batteries are more resistant to corrosion than lead-acid batteries. For example, lithium batteries have stainless steel or brass terminals and connectors that are less likely to rust or oxidize than lead-acid batteries. They also have BMS that prevent overcharging and undercharging that can cause corrosion.

Cost

The cost of a battery is another factor to consider when choosing a battery. It includes the initial purchase price, the installation cost, the maintenance cost, and the replacement cost. But in 2024, its usually far cheaper per cycle to purchase a Lifepo4 battery. Usually 5-10 times cheaper or more.

Purchase Price

The purchase price of a battery is the amount of money you pay upfront to buy the battery. It is usually based on the capacity, power, and quality of the battery.

Lithium batteries have a higher purchase price than lead-acid batteries of the same capacity and power. For example, a 100Ah lithium battery can cost around $400-$600, while a 100Ah lead-acid battery can cost around $300-$600. This is because lithium batteries use more advanced and expensive materials and technologies than lead-acid batteries, but recently the competition of Lithium Iron Lifepo4 has lead to very similar prices

Installation Cost

The installation cost of a battery is the amount of money you pay to install the battery in your vehicle or vessel. It is usually based on the size, weight, and complexity of the battery.

Lithium batteries have a lower installation cost than lead-acid batteries of the same capacity and power. For example, a 100Ah lithium battery can weigh around 12kg and take up around 20L of space, while a 100Ah lead-acid battery can weigh around 30kg and take up around 40L of space. This means that lithium batteries are easier and cheaper to install than lead-acid batteries, especially in tight and limited spaces.

Maintenance Cost

The maintenance cost of a battery is the amount of money you pay to maintain the performance and lifespan of the battery. It is usually based on the frequency, complexity, and necessity of the maintenance tasks.

Lithium batteries have a lower maintenance cost than lead-acid batteries. For example, lithium batteries are maintenance-free and do not require any watering, equalizing, or cleaning. They also have BMS that monitor and regulate their performance and health. Lead-acid batteries require regular maintenance such as watering, equalizing, cleaning, and checking for corrosion and sulfation. They also need external regulators to prevent overcharging and undercharging.

Replacement Cost

The replacement cost of a battery is the amount of money you pay to replace the battery when it reaches the end of its lifespan. It is usually based on the lifespan, availability, and recyclability of the battery.

Lithium batteries have a lower replacement cost than lead-acid batteries. For example, lithium batteries can last up to four times longer than lead-acid batteries, which means they need to be replaced less often. They are also more widely available and recyclable than lead-acid batteries, which means they are easier and cheaper to dispose of.

Environmental Impact

The environmental impact of a battery is another factor to consider when choosing a battery. It includes the energy consumption, greenhouse gas emissions, waste generation, and resource depletion associated with the production, use, and disposal of the battery.

Energy Consumption

The energy consumption of a battery is the amount of energy required to produce, charge, and discharge the battery. It is usually based on the efficiency, lifespan, and capacity of the battery.

Lithium batteries have a lower energy consumption than lead-acid batteries. For example, lithium batteries can store and deliver more energy from the same amount of solar or generator input than lead-acid batteries due to their higher efficiency. They also need less energy to produce due to their longer lifespan and smaller size.

Greenhouse Gas Emissions

The greenhouse gas emissions of a battery are the amount of carbon dioxide (CO2) and other gases released into the atmosphere as a result of the production, use, and disposal of the battery. They are usually based on the energy consumption, energy source, and recycling rate of the battery.

Lithium batteries have lower greenhouse gas emissions than lead-acid batteries. For example, lithium batteries can reduce CO2 emissions by up to 50% compared to lead-acid batteries due to their lower energy consumption and higher recycling rate. They also use renewable energy sources such as solar or wind more efficiently than lead-acid batteries due to their higher efficiency.

The production and carbon costs of Lead Acid vs Lithium, are very hard to know, with some saying Lithium is much worse, and it’s true that mining lithium and Iron and the other metals required may have a higher carbon footprint, but if you are using the battery daily, these will eventually become less.

Cranking Amps compared

When comparing cranking amps between LiFePO4 (Lithium Iron Phosphate) and lead-acid batteries, there are some important distinctions:

  1. LiFePO4 Batteries:
    • LiFePO4 batteries are more effective at delivering a large amount of current over a short period.
    • They are particularly suitable for applications where high cranking power is needed, such as starting engines or powering devices with significant initial current demands.
    • For instance, if you require a battery that can sustain a 40-amp device for two hours straight, LiFePO4 is an excellent choice
  2. Lead-Acid Batteries:
    • Lead-acid batteries have been around for a long time and are commonly used in various applications.
    • While they have their advantages, such as being cost-effective, they are not as efficient as LiFePO4 batteries in terms of cranking amps.
    • Lead-acid batteries may struggle to deliver high current consistently over a short duration compared to LiFePO4 batteries.

In summary, if you prioritize high cranking power and need a battery that can handle substantial current demands, LiFePO4 is the way to go.

News Blog
Kings vs Voltx Lithium Battery

Kings Vs VoltX Lithium Battery

Published: December 26, 2023 | Updated: March 1, 2025

Lithium Iron Phosphate (LiFePO4) batteries have become a game-changer for off-grid enthusiasts, campers, and 4WD adventurers across Australia. Among the most popular options in 2025 are the Kings 12V 120Ah Lithium LiFePO4 Battery and the VoltX 12V 100Ah LiFePO4 Basic Lithium Battery. Both are affordable, reliable, and widely available, but they cater to slightly different needs. Let’s dive into an updated comparison to help you decide which one suits your setup best.

120thumbnail1

Kings 120Ah Lithium LiFePO4 Battery Review

The Kings 12V 120Ah Lithium LiFePO4 Battery, offered by 4WD Supacentre, remains a staple for those seeking a dependable, budget-friendly energy solution in 2025. Here’s what it brings to the table:

Key Features:

  • Capacity: 120Ah – offering a bit more juice than its VoltX counterpart.
  • Chemistry: LiFePO4 with prismatic cells (approx. 3000-cycle rating individually, though pack performance varies).
  • Weight: Approximately 15kg – lightweight compared to AGM alternatives.
  • Cycle Life: Rated for 2000+ cycles at 80% depth of discharge (DoD).
  • Battery Management System (BMS): Integrated BMS with thermal protection, overload management, and high/low voltage cutoff.
  • Connectivity: Supports up to 2 batteries in parallel or 4 in series.
  • Warranty: 12 months – very short but price reflects warranty
  • Price (2025 Estimate): Around AUD $499 (up from $449 in 2023 due to inflation and supply chain adjustments).

Pros:

  • Larger 120Ah capacity means more runtime for power-hungry setups.
  • Widely available through 4WD Supacentre’s extensive retail network, offering easy customer support.
  • Solid BMS ensures safety and reliability for off-grid use.
  • Great value for the price – still one of the cheapest LiFePO4 options per Ah in 2025.

Cons:

  • No Bluetooth or app-based monitoring – a basic battery with no frills.
  • 12-month warranty is shorter than premium brands (though fair for the cost).
  • Some users report variability in long-term performance, possibly due to non-automotive-grade cells.

Best For:

Campers, boaters, or overlanders who need a reliable, no-nonsense battery for off-grid adventures without breaking the bank. In 2025, it’s still a top pick for those prioritizing capacity over advanced features.

Recommendation: We 100% recommend the Kings 120Ah for budget-conscious users who don’t need fancy extras. There are better batteries out there, but few match this price-to-performance ratio.


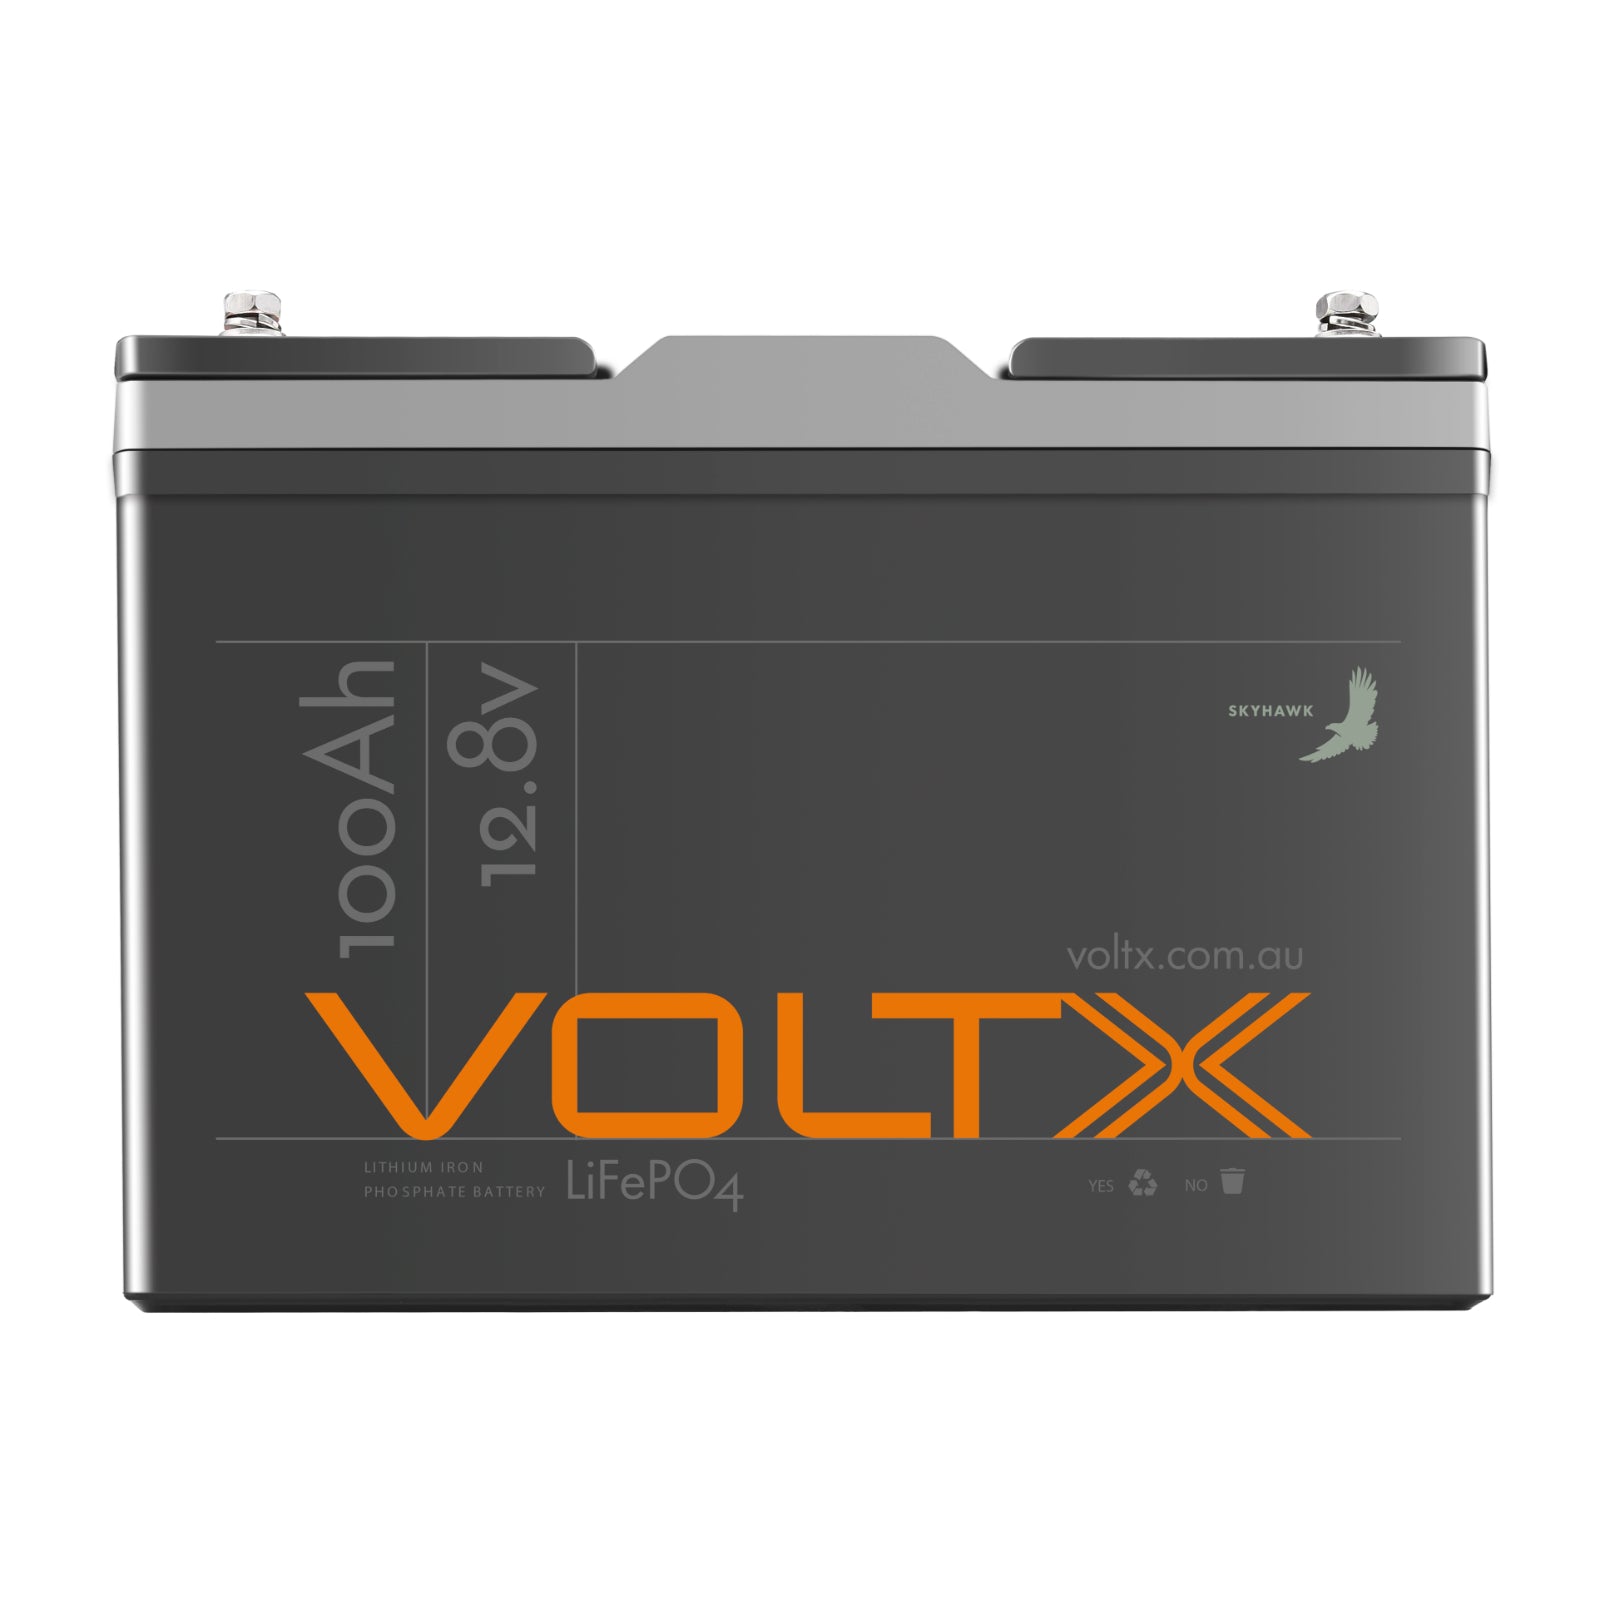
VoltX 12V 100Ah LiFePO4 Basic Lithium Battery Review

image

Key Features:

The VoltX 12V 100Ah LiFePO4 Basic Lithium Battery, sold by Outbax, continues to impress with its simplicity and performance in 2025. Here’s the latest rundown:

  • Capacity: 100Ah – slightly less than the Kings but still ample for most light applications.
  • Chemistry: LiFePO4 with A-grade prismatic cells.
  • Weight: Around 11kg – lighter than the Kings, making it easier to move.
  • Cycle Life: Advertised at 4000 cycles (though real-world testing suggests 2000-3000 cycles at 80% DoD).
  • Battery Management System (BMS): Integrated BMS protects against overheating, overcharging, and short circuits.
  • Connectivity: Officially not recommended for parallel/series connections, though some users report success with parallel setups.
  • Warranty: 36 months – a big step up from Kings.
  • Price (2025 Estimate): Around AUD $429 (up from $399 in 2023, reflecting market trends).

Pros:

  • Lightweight and compact – ideal for portable setups.
  • Longer 36-month warranty offers peace of mind.
  • Positive user feedback for reliability, especially with solar charging.
  • Outperforms AGM batteries in charging speed and weight.

Cons:

  • 100Ah capacity limits its use for larger setups compared to the Kings.
  • No Bluetooth or advanced monitoring – like the Kings, it’s a basic battery.
  • Mixed messaging on parallel/series connections could confuse users.

User Feedback (Updated for 2025):

  • Richard B. (Adelaide, SA): “Still faultless after 18 months. Runs my 40L and 60L fridges for days via solar. Best bang for buck in 2025.”
  • Anonymous (VIC): “Perfect for my off-grid cabin. Charges fast and weighs next to nothing compared to my old AGM.”
  • Tom H. (QLD): “Outlasts my old lead-acid by miles. Two years in, and it’s still going strong.”

Best For:

Light off-grid applications like small fridges, LEDs, or solar-powered setups where portability and warranty matter more than raw capacity.


Head-to-Head Comparison (2025)

FeatureKings 120AhVoltX 100Ah
Capacity120Ah100Ah
Weight~15kg~11kg
Cycle Life2000+ cycles2000-3000 cycles
BMSYes (basic)Yes (basic)
Connectivity2 parallel / 4 seriesNot recommended
Warranty12 months36 months
Price (2025)~AUD $499~AUD $429
Availability4WD Supacentre (online and retail stores)Outbax (online-focused)

Key Differences in 2025:

  • Capacity: Kings wins with 120Ah vs. VoltX’s 100Ah – a 20% edge for bigger loads.
  • Weight: VoltX is lighter by 4kg, a bonus for portability.
  • Warranty: VoltX’s 36 months trumps Kings’ 12 months, appealing to long-term users.
  • Price: Kings is slightly more expensive, but you get more capacity per dollar.
  • Support: Kings’ physical stores offer an edge over VoltX’s online-only model.

Which Should You Choose in 2025?

  • Choose Kings 120Ah if:
    • You need more capacity for larger fridges, inverters, or multi-day trips.
    • You value in-person support and availability at 4WD Supacentre locations.
    • Budget is tight, and you’re okay with a shorter warranty.

  • Choose VoltX 100Ah if:
    • Portability and lighter weight are priorities.
    • You want a longer warranty for peace of mind.
    • Your setup doesn’t demand more than 100Ah (e.g., small solar or camping rigs).

Final Thoughts

In 2025, both the Kings 120Ah and VoltX 100Ah LiFePO4 batteries remain solid choices for budget-conscious Aussies ditching lead-acid batteries. Neither offers Bluetooth or premium features, but they deliver where it counts: reliable power at a fair price. Kings edges out for capacity and retail presence, while VoltX shines with its warranty and portability.

For most casual users, the Kings 120Ah is our top pick unless the VoltX’s lighter weight or longer warranty sways you. Either way, you’re getting a dependable LiFePO4 battery that’ll outlast AGM options every day of the week.

News Blog
Hithium 280ah 12000 cycle LFP cells used in 400MWh The largest standalone battery storage project in China

The 200MW/400MWh battery energy storage system (BESS) is live in Ningxia, China, equipped with Hithium lithium iron phosphate (LFP) cells.

Established 3 years ago in 2019 is already ramping up to a target of more than 135GWh of annual battery cell production capacity by 2025 for a total investment value of about US$4.71 billion.

The project was connected to the grid earlier this month, through a system integrator called ROBESTEC, about which little information appears publicly available. However, it is understood that although Hithium makes and provides complete BESS solutions as well as cells, in this case, it was the cell supplier.

200MW/400MWh HITHIUM LFP BESS in China

China 400MWh Hithium 12000 cycle LFP Battery 1

The facility stores energy at times of abundant generation from solar PV and wind, putting it into the grid during times of peak demand. It will also help regulate grid frequency.

If you are interested in these new 280AH cells, which Hithium and CATL currently can produce specifically for ESS use, let us know, as we have access to the cells when the demand is slightly lower. As these are actually in high demand for commercial applications, and they technically are hard to get for the DIY community.

it’s expected this giant LFP battery will cut CO2 emissions by 501,000 tons per year

Hithium specializes in the R&D, production, and sales of LFP energy storage batteries and systems. With strong customer orientation, they are committed to providing safe, efficient, clean, and sustainable energy storage solutions for the world. Hithium now has over 4400 employees globally including over 1000 R&D engineers with extensive experience in energy storage. With a planned 4.71 billion USD total investment and 1,400,000m2 factory space to achieve 135GWh production capacity of the energy storage battery in 2025.

Xiamen Haichen New Energy Lithium Battery
Hithium-280ah-LFP280 12000 Cycles Storage Grade
280ah capacity test
Hithium_280ah_test_results

We delivered these cells in 2022 to a few customers and currently have a small shipment arriving again in February 2023. As they are an unknown brand to many customers, we haven’t ordered large quantities, because many customers still want EVE, CATL, LiShen, CALB, and various other brands they have heard of. It’s just not a well-known brand,

In the past was a bad thing, But with this type of new technology, sometimes it’s a great thing to get in early while you can.

News Blog
12v Solar Panel Market in Australia

The 12v solar panel market in Australia is about as bad as Aliexpress. Advertised panel outputs are grossly exaggerated, usually by 200-300%.

This post will be short and sweet, but some very simple math allows us to work out rough outputs from the panels available on eBay and even reputable retailers such as 4×4 Supacentre and online marketplaces such as www.catch.com.au.

A solar panel is usually something like 15-18% efficient in the 12v marketplace. It is extremely rare that they will actually output 20% or higher and if they do, they are probably 10x times more expensive than what you are looking at paying on the online marketplaces.

An example of what to expect from an eBay 350w solar panel is probably something like 80-120W. If you work out that 1000w of sunlight falls per metre squared that is STC and the panel is 1270mm x 710mm and area of about 0.9m2. You can multiply that by 0.15 (15%) to get the wattage (if you need the calculation, do a google search). So, anyhow 0.9 x 0.15 is 135w. Now add in the NOCT rule of thumb, reduce that number by about a quarter and you will get 101w of power from that solar panel under normal operating conditions.

Given that you are paying about $170 for that panel. You are actually paying far too much for those solar panels you buy online and losing valuable roof space as a consequence.

Some people have caravans and off-grid requirements, so recently people have been looking to the house panel marketplace, this is a better option but only if you have the space available to install that size panel, and it also means your voltage may increase, which is fine as long as you take that into consideration.

It is illegal in Australia to work on any DC electrical system or panels with a voltage higher than 50V DC. This means you need to ensure you don’t run the panels in series of anything higher than that number unless you are a licensed electrician with the appropriate qualifications.

There are some exceptions to the marketplaces with Vendors such as Renogy. They actually do offer a more realistic wattage for their products, of course, you should still take roughly a quarter off the advertised wattage, because of the NOCT (normal operating conditions) rule. But at least you know what you are actually buying.

We will soon create a buyers guide and even list some good quality products on our website, so you don’t have to get ripped off buying completely rubbish claims made by online retailers.

News
Weize 12V 100Ah LiFePO4 Australia

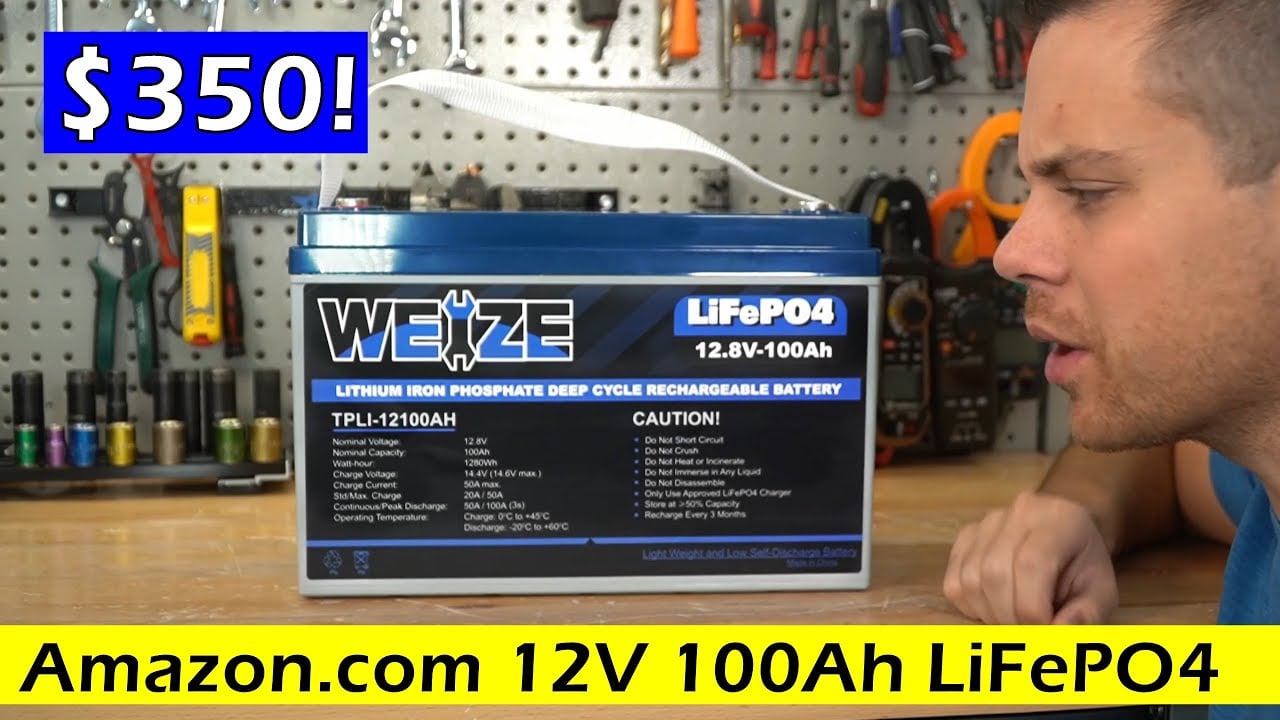
Recently we watched Will Prowse review a OEM battery that we can and have been able to source in small quantities for some time, one of our trusted suppliers sent us one of these Batteries for review last year, this battery is a made-to-specification battery by one of the largest LIFEPO4 drop-in replacement manufacturers in China. You probably have some questions you want to know the answer about China and the Lithium drop-in replacement industry, because its really hard to know who is making and selling what. And its an eye opening journey.

Over the past few years, a few of the OEM Battery suppliers have come up with some reliable and high quality drop-in replacements. This is one of the reasons Will has only recently discovered these better quality OEM batteries. Because they have been a work in progress, as each company gets a little better, so do the batteries they produce.

If you think, it’s actually in the best interest of both the consumer and the manufacturer to make a battery that does work and doesn’t fail. The competitive nature of business drives the improving product all the time.

We have been testing batteries like this since 2015. And they have been available in a similar form since about 2014 from these manufacturers.

What has happened is that the product has matured, they have got to the point where the BMS is very reliable, and the cells are better than what most people need.


To find out why we won’t be importing this Weize 12V 100Ah LiFePO4 Battery in bulk read along further

Questions

Q. Can we get this in 50ah, 100ah, and 200ah capacity from the same manufacturer?
A. Yes, we can

Q. Will we be ordering these into stock?
A. No, we won’t, because there are too many brands of 12v 100ah drop-in, already on the market, and we would prefer to only bring in products we love and recommend for our customers.

Q. How much would we charge for this?
A. Not as much as you might think, being Amazon is very competitive, the price of this is $350-450USD.

Lets do some quick math. based on the 2 prices $350USD and $450USD.

$350 = $470 AUD
$470 + 10% GST = $517
$517 + 5% DUTY = $542.85
$542.85 + Shipping $60±
$600± AUD

$450 = $603 AUD
$603 + 10% GST = $663.30
$663.30 + 5% DUTY = $696.50
$696.50 + Shipping $60±
$766.50± AUD

As you can see, there is no real business case for importing these into Australia. In fact they are already here, just labelled with a different brand. I know these are here in the $600-1000 range already.

It does make you wonder, should you buy a $400 eBay battery or should you buy a $2000 Enerdrive? In my view, I would buy somewhere in the middle, but I also build my own batteries which I prefer, as I can choose which cells I use, and which BMS I use, and that is exactly why we at Lifepo4 Australia choose to use the EVE and Ganfeng lithium cells primarily, because they are both A grade products, and they both use Australian Lithium inside them.

I don’t know about you but if Victron would just release a 100ah battery for $600-800, they would destroy every other battery retailer in one go. As long as it had 4 Series and 4 parallel, with an easy to use management software for when it’s used in various configurations. Victron would absolutely own the market.

News
Who makes Lithium Batteries?

Brands who manufacture Lithium Batteries

1. China – CATL
2. South Korea – LG Chem
3. Japan – Panasonic

These 3 Brands enjoyed a combined EV battery market share of 68%, according to Goldman Sachs’ estimates in 2020/21 FY.

201207 Four Companies 03
1567578380267439

#1 CATL – Contemporary Amperex Technology Co. Limited, abbreviated as CATL, is a Chinese battery manufacturer and technology company founded in 2011 that specializes in the manufacturing of lithium-ion batteries for electric vehicles and energy storage systems, as well as battery management systems.

#2 LG Chem Ltd often referred to as LG Chemical, is the largest Korean chemical company is headquartered in Seoul, South Korea. first established as the Lucky Chemical Industrial Corporation, which manufactured cosmetics. It is now solely a business-to-business company.

#3 Panasonic – Famous around the world, a japanese conglomorate who has been enourmously successful for decades
#5 BYD – The newest entrant here, Build YOUR DREAMS is an AMAZING COMPANY THAT IS GOING TO BE ONE OF THE LARGEST COMPANIES IN THE WORLD WITHIN 5-10 YEARS
#4 CALB

Other Manufacturers
EVE Energy
Winston
Headway

Links to DYOR
1. Forbes Link
2. GlobalX Link

News Home
LiFePO4 SOC: Voltage Charts, Charging & Battery Percentage

The practical battery reference

LiFePO4 SOC Voltage charts, charging & battery percentage explained.

LiFePO4 SOC means state of charge: the estimated percentage of charge remaining in your battery. A voltage reading helps, but it cannot reliably tell you that percentage through most of the battery’s range.

Use the rested voltage table for a quick reference, explore a measured test, or jump straight to monitor setup, charging and runtime.

A reading needs context

13.2 VHow full is that?

About halfway in our rested reference. Under load or while charging, the same number can tell a different story.

01 / The quick reference

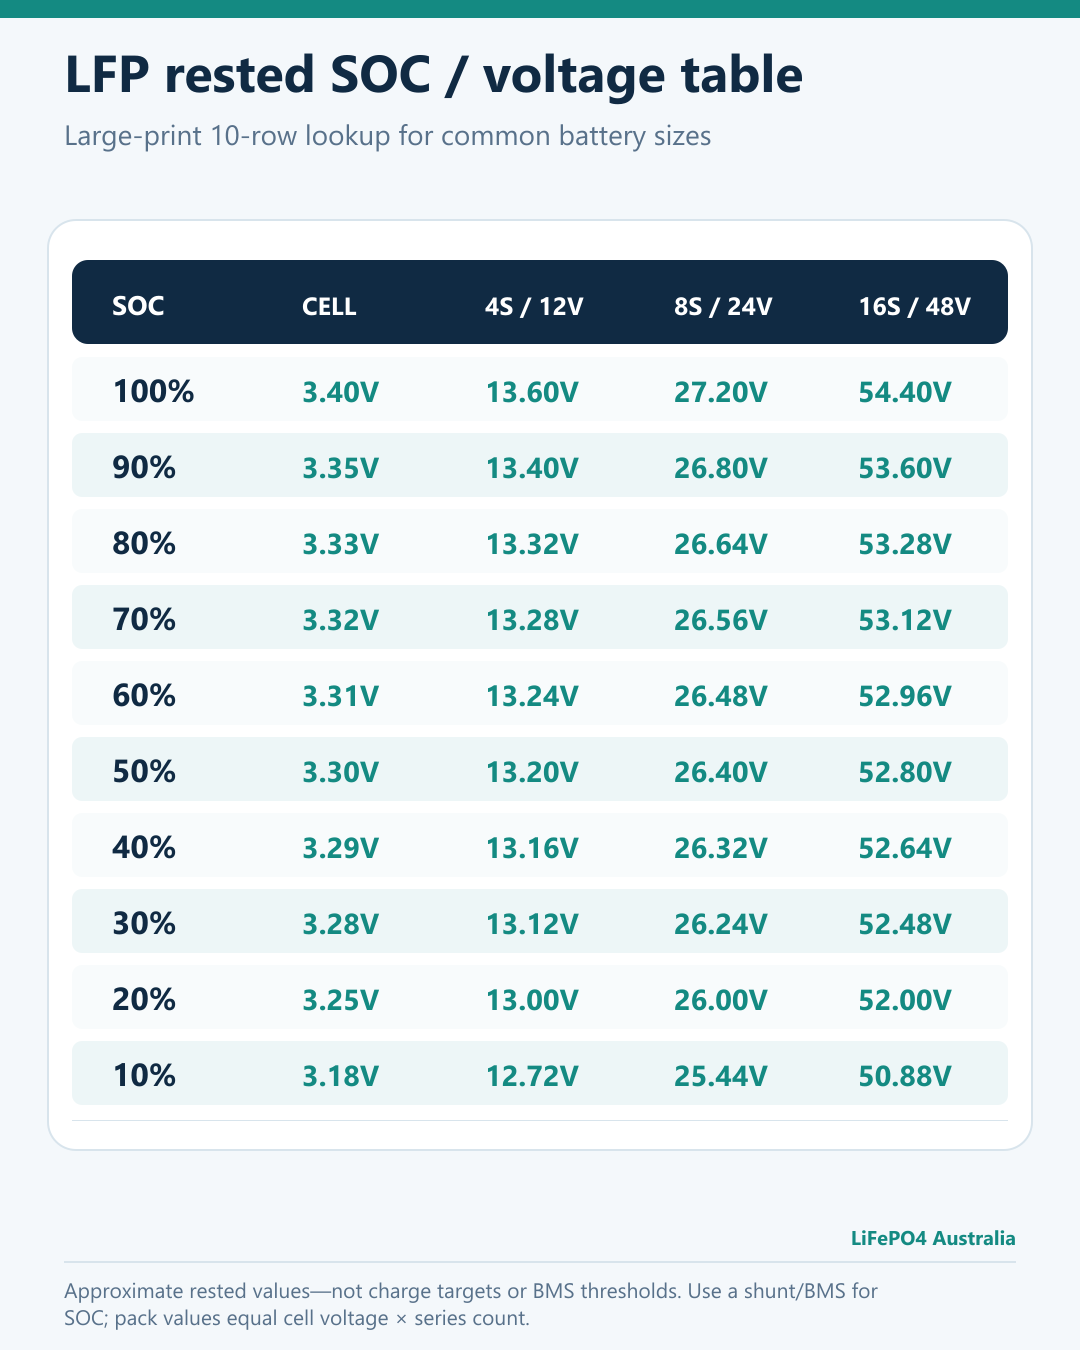
LiFePO4 SOC voltage chart: rested battery

Use this as a practical orientation chart after charging and loads have stopped and the voltage has settled. These are the values from our rested SOC reference graphic. They are approximate, not charger targets or BMS protection settings.

Find your battery voltage

Approximate rested values
Approximate SOC4S / 12 V battery
100%13.60 V
90%13.40 V
80%13.32 V
70%13.28 V
60%13.24 V
50%13.20 V
40%13.16 V
30%13.12 V
20%13.00 V
10%12.72 V

Read the trend, not the last decimal

13.2 V is around halfway in this 12 V reference. It is not proof of 50% SOC. In the flat middle, a small change in voltage can cover a wide capacity range.

For example, this table places 80% at 13.32 V and 40% at 13.16 V. That is just 0.16 V across 40 percentage points. Load, temperature, recent charging and the particular cells can easily change the interpretation.

For an installed battery: use this chart as a sense check. Use calibrated BMS/shunt data for the percentage, and cell-level measurements and alarms for protection.

Before reading the table: confirm the series count, stop charging and loads, and allow voltage to settle. “48 V lithium” is not automatically 16S LiFePO4.

These lookup points are an approximate practical guide, without a published controlled rest-test dataset. Their SOC estimates will vary between batteries and conditions.

See why conditions matter

Now compare charging and discharging

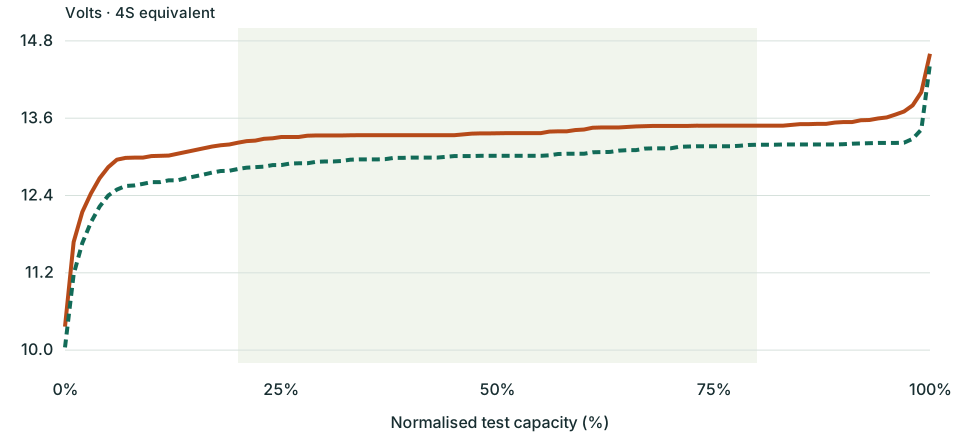
The chart below uses Off-Grid Garage’s measured EVE MB31 test. Unlike the rested reference, current is flowing. Explore the curves to see why a voltage table needs context. [1]

One cell. Two very different curves.

EVE MB31 · 40 A test · cell and calculated pack voltages

Measured data
ChargingDischarging
Measured EVE MB31 charge and discharge curves scaled to a 4S battery. Voltage is nearly flat over much of the capacity range, and charging voltage is higher than discharge voltage.

How to read this: percentages are normalised to each test’s measured capacity. Discharge runs from right to left; charge runs left to right. Pack voltages are cell voltage × series count, not a separate pack test. This is a dynamic test, not a rested-voltage lookup for your battery. Temperature was not stated. See test conditions and method.

The useful lesson: in this discharge test, moving from 80% to 40% changed the cell voltage by only about 0.05 V—about 0.20 V for four identical cells. A small voltage difference can hide a large amount of remaining capacity.

Show measured discharge samples: 12 V, 24 V and 48 V

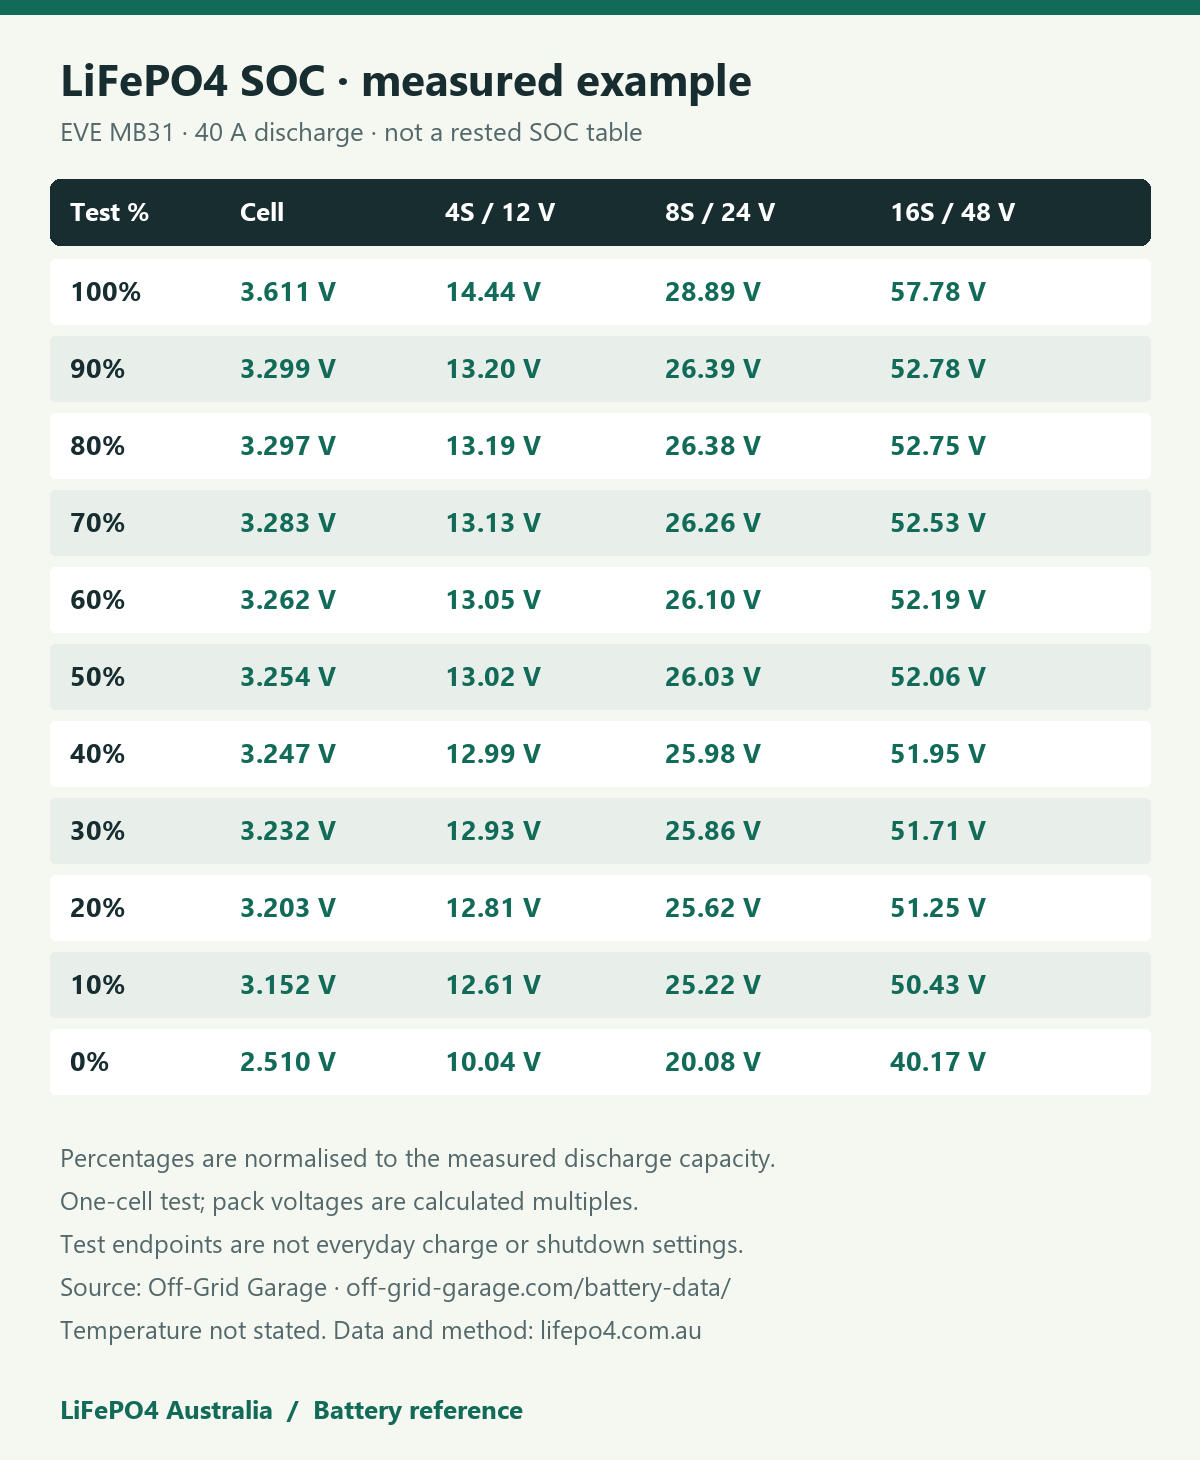
These are samples from the 40 A discharge test above. The percentages refer to remaining measured test capacity. They are included so you can inspect the data, not use it as a universal fuel gauge.

EVE MB31 test reference · calculated pack equivalents
Test %Cell4S / 12 V8S / 24 V16S / 48 V
100%3.611 V14.44 V28.89 V57.78 V
90%3.299 V13.20 V26.39 V52.78 V
80%3.297 V13.19 V26.38 V52.75 V
70%3.283 V13.13 V26.26 V52.53 V
60%3.262 V13.05 V26.10 V52.19 V
50%3.254 V13.02 V26.03 V52.06 V
40%3.247 V12.99 V25.98 V51.95 V
30%3.232 V12.93 V25.86 V51.71 V
20%3.203 V12.81 V25.62 V51.25 V
10%3.152 V12.61 V25.22 V50.43 V
0%2.510 V10.04 V20.08 V40.17 V

The 100% sample is near the start of discharge after charging; it is not a rested full-charge voltage. The 0% sample is near the test endpoint, not a recommended everyday shutdown setting. Values are rounded from the underlying samples.

UNDER LOAD

Voltage falls

An inverter or other load pulls the voltage down. A bigger load can make the same battery look emptier on a voltage-only display.

WHILE CHARGING

Voltage rises

The charger pushes voltage up. Reaching a particular voltage does not, by itself, prove that the battery is full.

AFTER RESTING

Voltage settles

A resting reading removes the immediate load or charge effect. The flat middle and charge history still make an exact percentage unreliable.

02 / The numbers that matter

SOC, capacity and runtime are different things

SOC is a percentage of a capacity estimate. If a battery really has 100 Ah available and its SOC estimate is correct, 50% represents about 50 Ah remaining. That is charge, not a promise of a particular number of hours.

A 100 Ah battery and a 300 Ah battery can both show 50%. The larger battery holds roughly three times as much charge. Likewise, 100 Ah at 51.2 V represents four times the nominal energy of 100 Ah at 12.8 V.

Battery health changes the size of the tank. An ageing battery can reach 100% SOC while storing less than it did when new. Its monitor needs a realistic capacity basis to keep that percentage useful.

SOCState of charge: how full the estimated capacity is.
AhAmp-hours: charge capacity. Compare at the same voltage.
WhWatt-hours: energy. Approximately nominal volts × amp-hours.
SOHState of health: condition relative to new. Capacity is one measure; resistance and power capability also matter.

Series adds voltage. Parallel adds amp-hours. Four 100 Ah cells in series make a nominal 12.8 V, 100 Ah battery—not 400 Ah. Four compatible 12.8 V, 100 Ah batteries in parallel make a nominal 12.8 V, 400 Ah bank.

The arithmetic does not mean any batteries can be connected together. Completed batteries must support the intended series/parallel arrangement. A “48 V” label alone also does not confirm 16S; some LFP systems are 15S.

What does “100%” actually mean?

For a monitor, 100% is a reference point established by its full-charge detection rules or a manual reset. For a capacity test, it is the starting point under a specified charge procedure. For a complete battery, displayed SOC can also include manufacturer-defined reserves.

Those definitions need not be identical. A display reaching 100% is not proof that every cell is balanced, and a battery showing 95% is not automatically missing 5% of its rated capacity. Look at the measurement method, actual charge completion and usable energy.

03 / Get a reading you can use

How to measure LiFePO4 SOC accurately

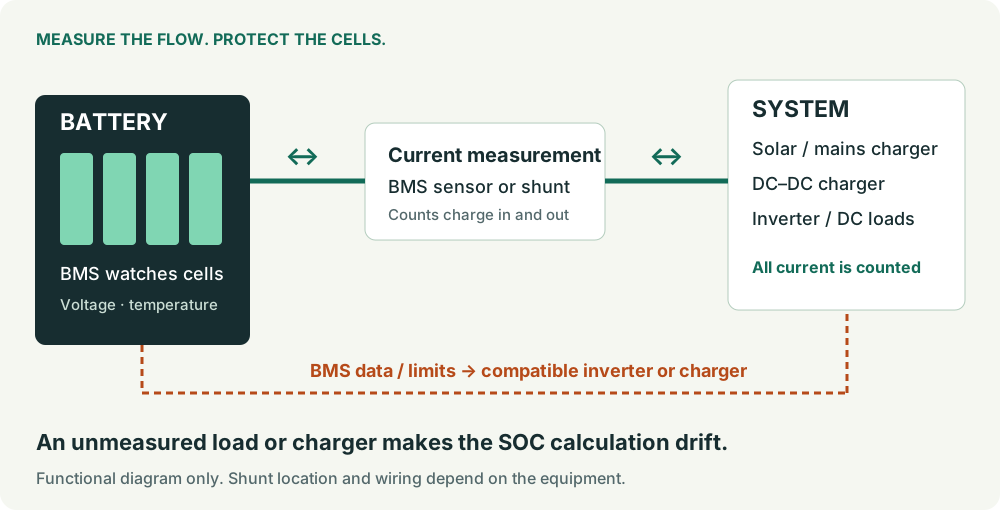
Use a monitor that measures battery current and counts charge in and out. That may be built into the BMS, or it may be a separate shunt. A communicating BMS is useful only when its measurements are sound and the inverter is actually using its SOC data.

1. Measure all battery currentSolar, alternator, mains charger, inverter and smaller DC loads must be included in the measurement.
2. Use the right capacityCheck the battery or bank’s Ah rating and configuration. Revisit it if a valid test shows meaningful capacity loss.
3. Establish true fullSynchronise after the battery completes its proper charge procedure. Then let the monitor count from that reference.
Conceptual diagram: battery current passes through a shunt to all loads and chargers. A BMS monitors cells and sends data and charge limits to a compatible inverter. A bypassed current path produces a wrong SOC estimate.
Two jobs: measure energy flow and protect the cells. A shunt provides current measurement; the BMS supplies cell-level protection. This is a functional diagram, not a wiring plan. Select the image to enlarge.

A common shunt mistake is an unmeasured connection. In a negative-side shunt installation, a load or charger connected directly to battery negative bypasses the measurement. The monitor cannot count what it cannot see. Victron’s installation instructions put all system negatives on the system side of the shunt. [2]

Why SOC drifts

Current measurement has a small error; the configured capacity may be imperfect; charging is not perfectly efficient. Those errors accumulate. For example, a constant 0.1 A measurement error over seven days equals 16.8 Ah. On a 100 Ah reference, that is 16.8 percentage points.

This is why a shunt is not “fit and forget”. It needs sensible settings and occasional reliable synchronisation. The worked example is arithmetic, not a claim about the accuracy of any specific monitor.

Do you need a separate shunt?

Already have a reliable BMS SOC reading? A second monitor is optional. It can be useful for checking the system, but two displays can disagree because their capacity settings or reset rules differ.

Only have a voltage-based percentage? A correctly installed current-counting monitor is a substantial improvement. This is especially useful where several chargers or DC loads sit outside the inverter’s own measurement.

Practical SmartShunt setup: what each setting does

For a Victron SmartShunt, use the current manual and your battery’s charge procedure. These controls have separate jobs: [3] [4]

  • Battery capacity: the Ah basis used to calculate percentage.
  • Charged voltage: the voltage condition for recognising full charge. It is not the charger’s voltage command.
  • Tail current: how low the current must fall while the voltage condition is met.
  • Charged detection time: how long those conditions must persist together.
  • Charge efficiency: compensation for the difference between charge put in and recovered.
  • Peukert exponent: correction for discharge-rate effects; Victron suggests 1.05 for lithium unless the supplier specifies otherwise.

Victron’s lithium guidance suggests 99% charge efficiency. Tail current must also suit a charger that terminates at its own current threshold. Those are device-specific starting points, not universal settings for every BMS.

Do not copy a lead-acid charged-voltage table into an LFP system without checking it. Select a full-detection condition that your completed LFP charge cycle can reliably meet, without allowing an ordinary partial solar charge to reset the monitor.

A worked full-charge detection example

Suppose a 100 Ah monitor has a 4% tail-current setting. Its current condition is below 4 A. If the charged-detection time is three minutes, the required voltage and current conditions must remain satisfied together for that period.

A passing cloud can also reduce solar current below 4 A. That does not mean the battery is full. This is why the voltage threshold and detection time matter alongside tail current. These numbers explain the logic; they are not a universal configuration prescription.

04 / Charge the battery, not the percentage

What voltage should you charge LiFePO4 to?

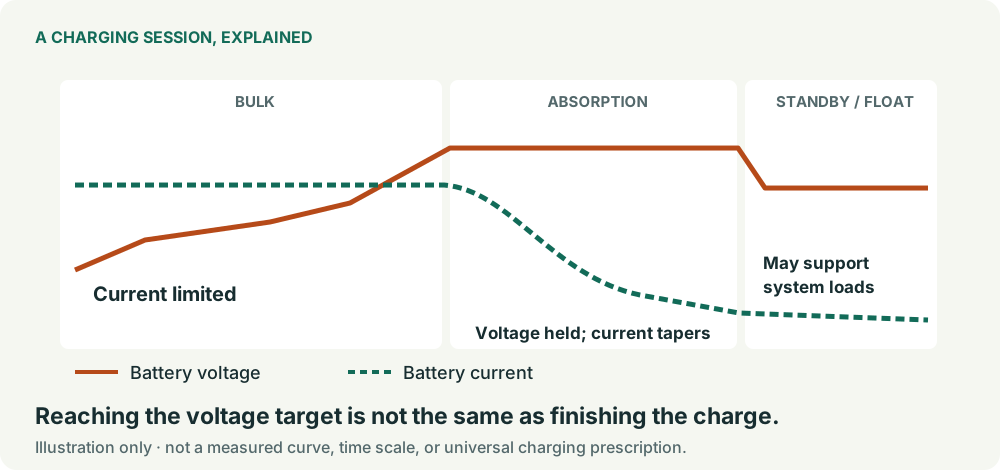
Use the charging profile for the completed battery. Cell voltage, charge current, time at that voltage and balancing behaviour work together. A charger reaching its target voltage does not necessarily mean the charge cycle has finished.

Illustrative charging sequence: current is limited during bulk charging while voltage rises; during absorption voltage is held and battery current falls; a standby stage may then support system loads. SOC cannot be inferred from reaching the voltage target alone.
Charging sequence, illustrated rather than measured. Phase lengths and curves are not a timing or capacity specification. Real solar systems also respond to available sun and active loads. Select the image to enlarge.
Four voltage numbers that should not be confused
NumberWhat it meansWhat it does not tell you
Nominal voltageA useful label: 3.2 V per LFP cell, or 12.8 / 25.6 / 51.2 V for 4S / 8S / 16S.An exact resting voltage or percentage.
Charge / absorption targetThe voltage the charger aims to hold for the relevant part of its cycle.That every cell is full or balanced the instant it is reached.
Full-charge detection thresholdA condition the monitor or BMS uses to synchronise its SOC estimate.An instruction for the charger to stop, unless that system explicitly uses it that way.
BMS overvoltage protectionA cell-level protection limit.A normal charging target. Repeated trips need investigation.

A concrete manufacturer example

For its Lithium Battery Smart range, Victron recommends 14.2 V absorption and 13.5 V float for a 12.8 V battery, with corresponding values for larger series banks. Its balancing procedure also requires time in absorption; “LFP never needs absorption” is too broad. [5]

Victron Lithium Battery Smart example—not a universal LFP preset
Setting4S / 12.8 V8S / 25.6 V16S / 51.2 V
Absorption14.2 V28.4 V56.8 V
Float13.5 V27.0 V54.0 V

Other batteries can use different profiles. A lower-voltage daily target can be appropriate, provided it still works with the battery’s full-charge detection and balancing. The long-life charging guide explains the 3.45, 3.50 and 3.55 V/cell options and how current limits interact with SOC and temperature.

Can I charge to 100%?

Yes, when the battery’s procedure allows it. Full charging can provide needed capacity and support synchronisation or balancing. That is different from holding a battery at a high charge voltage indefinitely.

Must I stay at 20–80%?

No. A narrower window is an operating choice, not a law of LFP chemistry. It trades usable capacity for gentler service. Select a reserve that fits your loads and recharge opportunities.

Does LFP need float?

It does not need lead-acid-style maintenance charging. A suitable float stage can still support ongoing system loads. Follow the intended battery/charger combination.

Balancing and SOC calibration are not the same thing

Calibration corrects the gauge; balancing addresses differences between cells. Resetting SOC to 100% does not move charge between cells. Changing a capacity setting does not fix a weak cell. A balancer also needs enough current and time to do its job.

Small cell-voltage differences in the flat middle do not prove equal SOC. Watch how the cells behave towards charge completion and under load. A cell that repeatedly reaches a limit before the others warrants checks of connections, measurements, balance and capacity. Do not solve a high-cell trip by raising its protection limit.

Cold charging: is 12°C a hard limit?

No. The 12°C cutoff in our long-life guide belongs to an optional conservative profile for repeated cold operation. It is not a universal manufacturer prohibition.

Actual limits depend on the battery. For example, Victron specifies charging its Lithium Battery Smart range between +5°C and +50°C. A different cell’s permitted temperature/current map does not override those completed-battery limits. [6]

Near or below freezing, use the battery’s explicit low-temperature procedure and protection. A heated battery must warm its cells before charging them outside their allowed range. Air temperature is not necessarily cell temperature.

Keep the distinction clear: manufacturer operating limits are boundaries; an extra longevity margin is a choice.

What really affects lifespan?

Temperature, time, charge/discharge conditions and the battery’s design all contribute. LFP ages while sitting as well as while cycling. Published research on LFP degradation shows that temperature changes the ageing mechanisms; there is no honest universal conversion from one cold charge to a fixed number of lost cycles. [7]

For everyday use: avoid unnecessary heat, repeated protection trips and leaving a discharged battery with parasitic loads attached. Use the capacity you need. If you choose a lower daily charge target, keep a deliberate plan for the full-charge events your battery requires.

For a cycle-life claim, ask for temperature, depth of discharge, rate and end-of-life capacity. “Thousands of cycles” without those conditions is incomplete information.

05 / Turn the percentage into something useful

How long will my battery last?

A runtime estimate needs capacity, voltage, the SOC you plan to use and the load. Enter those values below to estimate how long your load can run.

Battery runtime estimator

Constant AC load · nominal energy approximation · no charging during the estimate

Calculated example

Worked example: 12.8 V × 100 Ah × (80% − 20%) = 768 Wh above reserve. A 100 W AC load at 90% inverter efficiency draws about 111 W from the battery: roughly 6.9 hours, before any additional idle or DC loads.

Use an efficiency figure appropriate to the load. Add separate standby draw only if it is not already included in that figure. This does not check inverter surge rating, battery power limits, cold-temperature capacity or voltage shutdown. Fridges and other cycling loads need a measured average, not just their nameplate wattage.

The formula and its limits

Usable energy ≈ nominal V × actual Ah × (starting SOC − reserve SOC) / 100.
Battery draw ≈ AC watts ÷ inverter efficiency + extra DC watts.
Runtime ≈ usable energy ÷ battery draw.

Efficiency is a decimal in the formula: 90% = 0.90. The calculator estimates energy; it does not verify that the battery can supply the requested power. A BMS or inverter may shut down before the chosen SOC reserve is reached.

For a better estimate, log real watt-hours used over a representative day and compare them with usable battery energy. Direct measurement captures load cycling that a simple constant-load calculation misses.

06 / Find the cause

LiFePO4 SOC reading wrong? Start here.

Choose the symptom that matches your system. Check the measurement before changing a charging limit. The monitor’s own troubleshooting guide is the place to confirm model-specific behaviour. [8]

The percentage jumps to 100% during charging

First check whether the monitor has just synchronised. Record the voltage, actual battery current and the full-detection settings at the jump. If it happens partway through an ordinary charge, the trigger may be too easy to satisfy.

Also check the capacity setting. Do not immediately raise charge voltage to “make the percentage behave”. Establish whether the battery was actually full or the gauge simply reset.

The battery is charged, but the display never reaches 100%

Check whether the real charge cycle can satisfy the monitor’s voltage, tail-current and time conditions. A lower charge target, early charger termination or ongoing loads can prevent the expected full-detection event.

Confirm the manufacturer’s charge procedure has completed before a manual reset. Repeated manual resets can hide the underlying configuration error.

The inverter and BMS show different percentages

Find out where each number comes from. The inverter may be estimating from voltage, reading another monitor or receiving BMS data through a selected protocol. Compare timestamps, communication status and capacity settings.

Choose the intended SOC source in the system configuration. Matching two displayed numbers is less useful than confirming that one sound measurement controls the right decisions.

The battery switches off while SOC still looks healthy

Read the BMS and inverter event logs. Look for low-cell voltage, overcurrent, temperature, communication loss or inverter undervoltage. Check cell spread and voltage under the actual load.

A healthy-looking percentage cannot override a cell hitting its limit. A loose connection, an unbalanced or weak cell, high load or an inaccurate gauge can all produce this symptom. Diagnose the logged cause; do not bypass the protection.

The percentage barely changes, or moves the wrong way

Compare the measured current with a known charge or load. Confirm direction, shunt orientation and that all current paths pass through the sensor. A wrong Ah capacity makes the percentage move too slowly or too quickly.

Never disconnect a high-current circuit just to test the display. Use the equipment’s normal controls and an appropriate commissioning procedure.

Voltage rises after switching the inverter off

That is usually voltage recovery after removing a load, not newly created charge. The immediate voltage drop and slower polarisation effects relax once current falls.

If a voltage-based percentage also rises, it may be following that voltage recovery. A current-counting monitor should not interpret the voltage rebound alone as a large amount of charge entering the battery.

Before asking for help, collect: battery/BMS model, series count, charger/inverter model, SOC source, pack voltage, highest and lowest cell voltage, battery current, cell temperature and the relevant alarm. A screenshot with these readings is much more useful than “the battery says 50%”.

07 / For readers who want the mechanism

Why LiFePO4 SOC is difficult to estimate

The flat voltage plateau and measurement sensitivity

An SOC estimator tries to infer an internal state from measurements. Voltage feedback becomes weak where the open-circuit voltage (OCV)–SOC curve is flat: a small error in voltage, temperature correction or model parameters can imply a large error in SOC.

This is an observability problem, not simply a need for a voltmeter with more decimal places. The measured curve above illustrates the practical difficulty, although a dynamic curve includes effects that an OCV model treats separately.

Accurate estimation therefore combines current integration, a capacity model and useful reference events. More advanced estimators can also use temperature-dependent models and filtering. The objective is a plausible state estimate, not an exact percentage derived from a single voltage sample. [9]

Resistance, relaxation and hysteresis are related but different

Under discharge, a simple model is terminal voltage ≈ OCV − I × R − polarisation. Charging changes the direction of those current-related terms. Remove the load and some voltage recovers quickly; other processes relax more slowly.

Hysteresis adds dependence on charge/discharge history. It is not the same thing as the immediate I × R drop, and “rested” is not one universal number of minutes. The rest protocol, temperature and required accuracy must be defined before comparing OCV measurements.

Our charge/discharge plot does not isolate these mechanisms. It shows their combined practical effect during the recorded tests. Analog Devices’ LFP fuel-gauging note explains how a flat voltage curve and hysteresis complicate estimation. [10]

Coulomb counting: the useful equation

For discharge, ignoring secondary corrections:

SOC change (percentage points) = −100 × ∫ I dt / C.

Use hours for time and Ah for capacity C, with discharge current positive. Charging adds charge, with an appropriate efficiency correction. Current offset, missed loads, a wrong capacity basis and unobserved self-discharge can each accumulate into error.

A full-charge reference corrects accumulated estimation error. It does not establish the battery’s usable capacity on its own; capacity measurement needs a defined charge/discharge test.

Why average pack voltage can miss a cell problem

Pack voltage is the sum of cell voltages. A sum does not tell you how those values are distributed. As an arithmetic example, a four-cell pack at 13.2 V could consist of four cells at 3.30 V, or one at 3.00 V and three at 3.40 V.

The total is identical; the cell-level situation is not. That is why a BMS monitors individual series groups and why pack SOC should be considered alongside highest/lowest cell voltage, temperature and active limits.

Why there is no voltage-to-SOC calculator on this page

Entering “13.2 V” and receiving “67%” would look helpful. Without the cell model, current, temperature, history and a validated model, the precision would be unjustified.

Instead, the chart lets you inspect an identified experiment, and the runtime calculator makes its assumptions visible. When a measurement cannot answer the question reliably, understanding that limitation is useful information.

08 / Inspect the evidence

Sources, chart data and editorial method

This guide combines manufacturer documentation, independently published measurements and worked calculations. The Off-Grid Garage test was not performed by LiFePO4 Australia. Illustrations explain a mechanism; they are not laboratory results. Prepared with AI-assisted writing and charting; sources and calculation methods are provided for inspection.

Exactly how the measured chart was prepared

The source is Off-Grid Garage’s EVE MB31 test using a ZKE-Tech EBC-A40L. The published method charges with a 40 A limit to 3.65 V, ending near 15.3 A, then discharges at 40 A to 2.5 V. The CSV headers report 329.70 Ah charged and 330.60 Ah discharged. Temperature was not stated.

The prepared dataset integrates current against time and samples at 1% intervals. Charging is expressed as charge put in relative to the charge-test total; discharging as charge remaining relative to the discharge-test total. They are independent normalisations, not an independent measurement of absolute electrochemical SOC.

Lines connect those samples without smoothing. Four-, eight- and sixteen-cell views multiply the cell voltage by series count. No cell variation, cable drop or pack imbalance is simulated. The endpoints are test boundaries, not normal operating recommendations.

Download the exact plotted dataset · Original shared measurement files

  1. Off-Grid Garage battery data — EVE MB31 charge/discharge measurements and published test procedure.
  2. Victron SmartShunt: installation — measurement paths and shunt connections.
  3. Victron SmartShunt: settings — charged voltage, tail current and detection time.
  4. Victron SmartShunt: lithium configuration — efficiency, Peukert exponent and discharge floor.
  5. Victron Lithium Battery Smart: operation — product-specific charge settings, balancing time and battery care.
  6. Victron Lithium Battery Smart: technical data — temperature range and defined performance conditions.
  7. Temperature-dependent degradation mechanisms in LFP batteries — published research on the relationship between operating conditions and ageing.
  8. Victron SmartShunt: troubleshooting — incorrect readings, synchronisation and capacity configuration.
  9. Shi et al.: adaptive LFP SOC estimation — research preprint on flat-curve observability, current bias, temperature and combining estimators.
  10. Analog Devices: fuel gauging LFP batteries — technical explanation of the voltage plateau, hysteresis and estimation methods.

Keep going when you need more detail

Long-life charging: voltage, temperature and BMS current limits
Connecting a JK inverter BMS to Victron
Building a 12 V, 24 V or 48 V LiFePO4 battery

Revision: 5 September 2026. Retained the practical rested SOC reference and added an attributed measured comparison; added chart exploration, runtime calculations, troubleshooting and clearer distinctions between charging targets, calibration and protection.

X