Blog Lithium Battery-school
EVE MB31 vs EVE LF334 vs REPT 345Ah: Which LFP Cell Should You Choose?

EVE MB31 vs EVE LF334 vs REPT 345Ah: Which LFP Cell Should You Choose?

Not all LiFePO4 battery cells are the same. Two cells can both be “LFP” and still be designed for very different use cases. Capacity, cycle life, current rating, internal resistance, compression requirement, formation process, electrolyte additives, electrode design, and intended application all affect how a cell behaves in the real world.

That is why it is not enough to say, “It is LFP, so it should last X cycles.” LFP is a chemistry family. The exact cell variant matters.

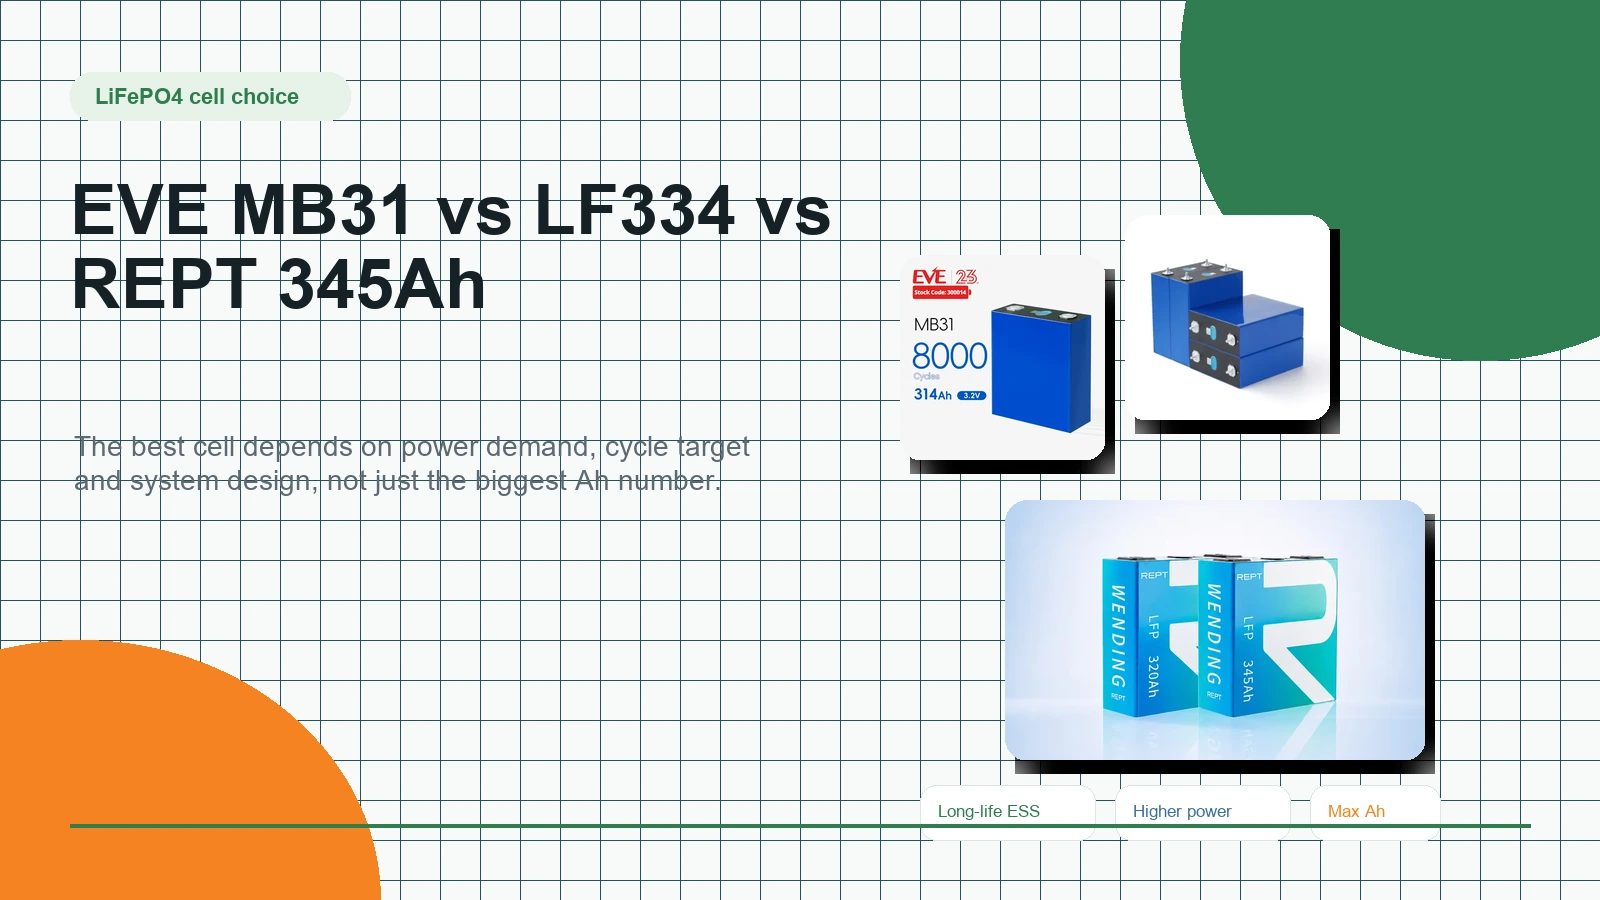
In this comparison, we look at three high-capacity prismatic LFP cells:

EVE MB31 314Ah EVE LF334 334Ah REPT 345Ah CB84

Each one can be an excellent choice, but they suit different systems.


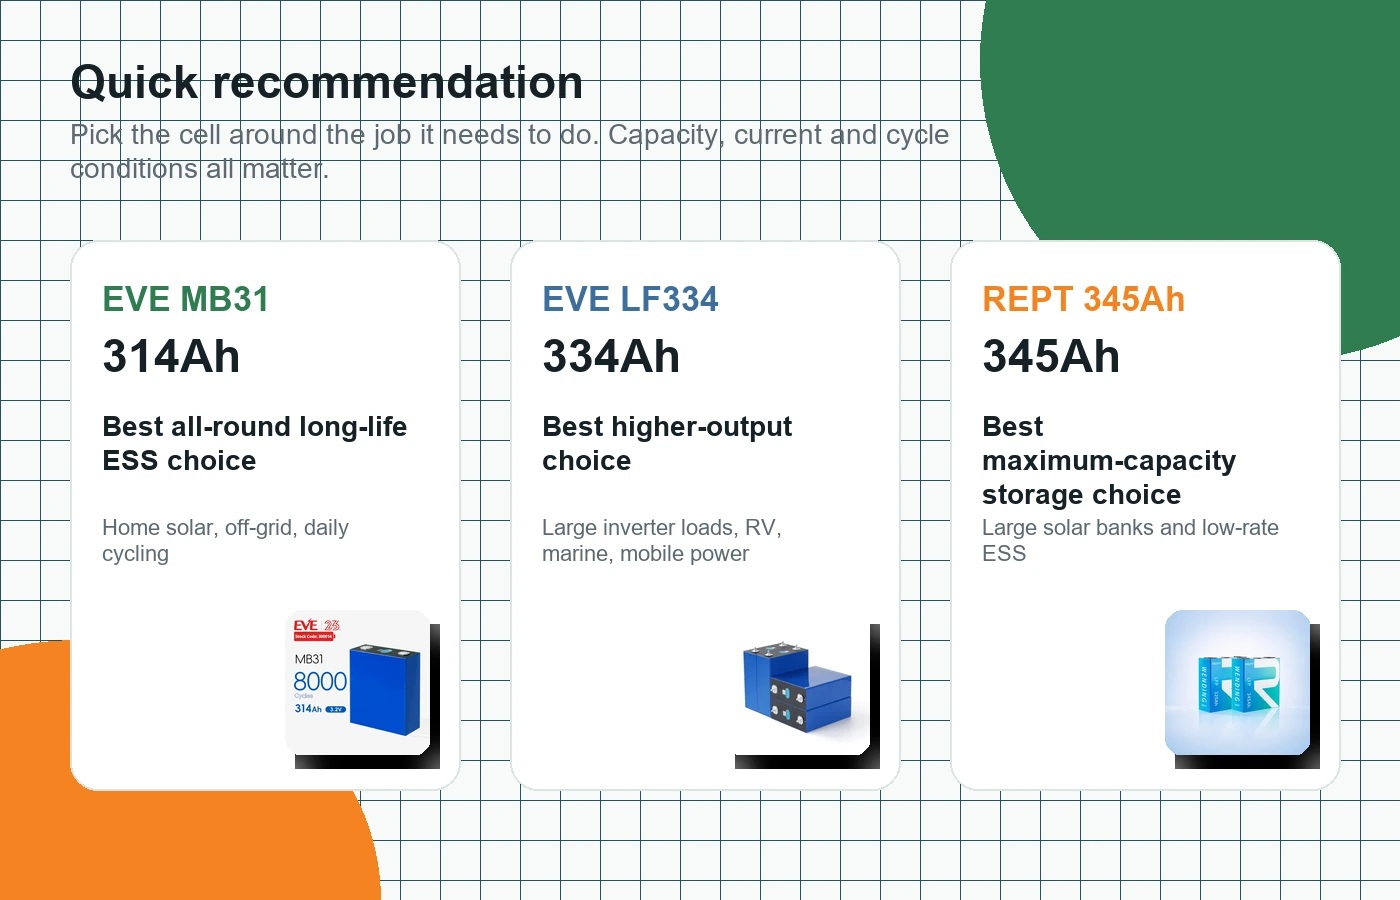
Quick Recommendation

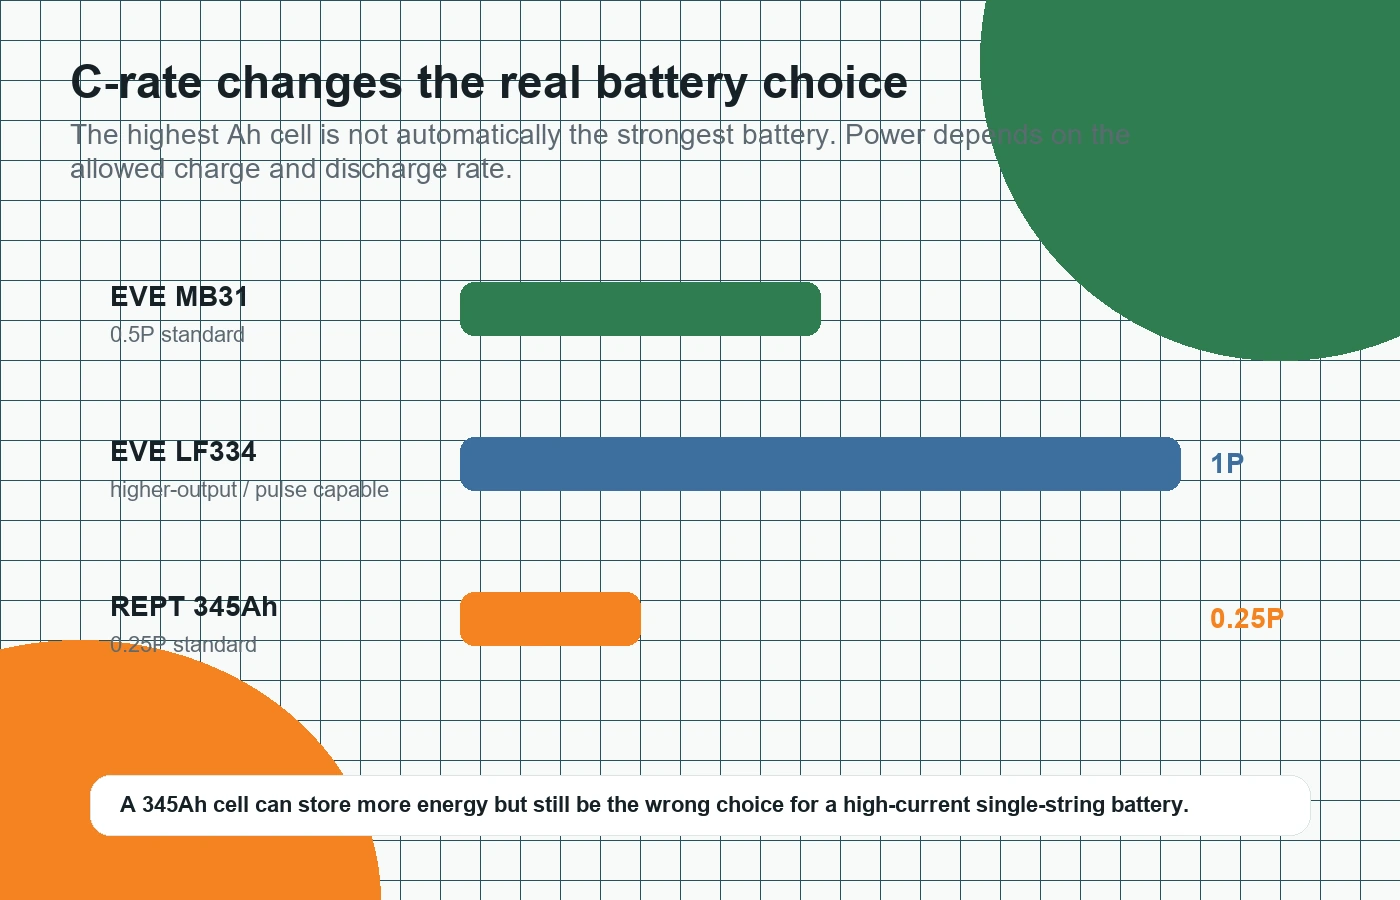
Choose the EVE MB31 if you want the safest all-round ESS choice: long cycle life, proven 314Ah format, moderate charge/discharge rate, and strong suitability for residential, off-grid, telecom, commercial, and utility energy storage. EVE’s official MB31 page lists 314Ah capacity, 3.2V nominal voltage, 8000 nominal cycles, and 0.5P/0.5P charge/discharge power, with applications including commercial, industrial, utility, telecom, and residential ESS. (evemall.eu)

Choose the EVE LF334 if you want more usable capacity and stronger power capability in a similar footprint. It is the better choice for high-demand 12V, 24V, and 48V systems where inverter surge, high current loads, or faster charge/discharge capability matter. Public listings commonly show 334Ah, 4000 cycles to 80% capacity, and up to 3C discharge capability, though the exact continuous-versus-pulse rating should always be confirmed against the batch datasheet. (NKON)

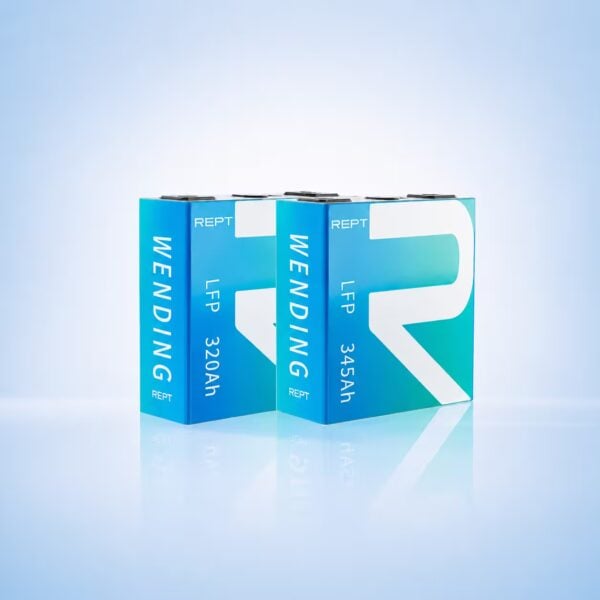
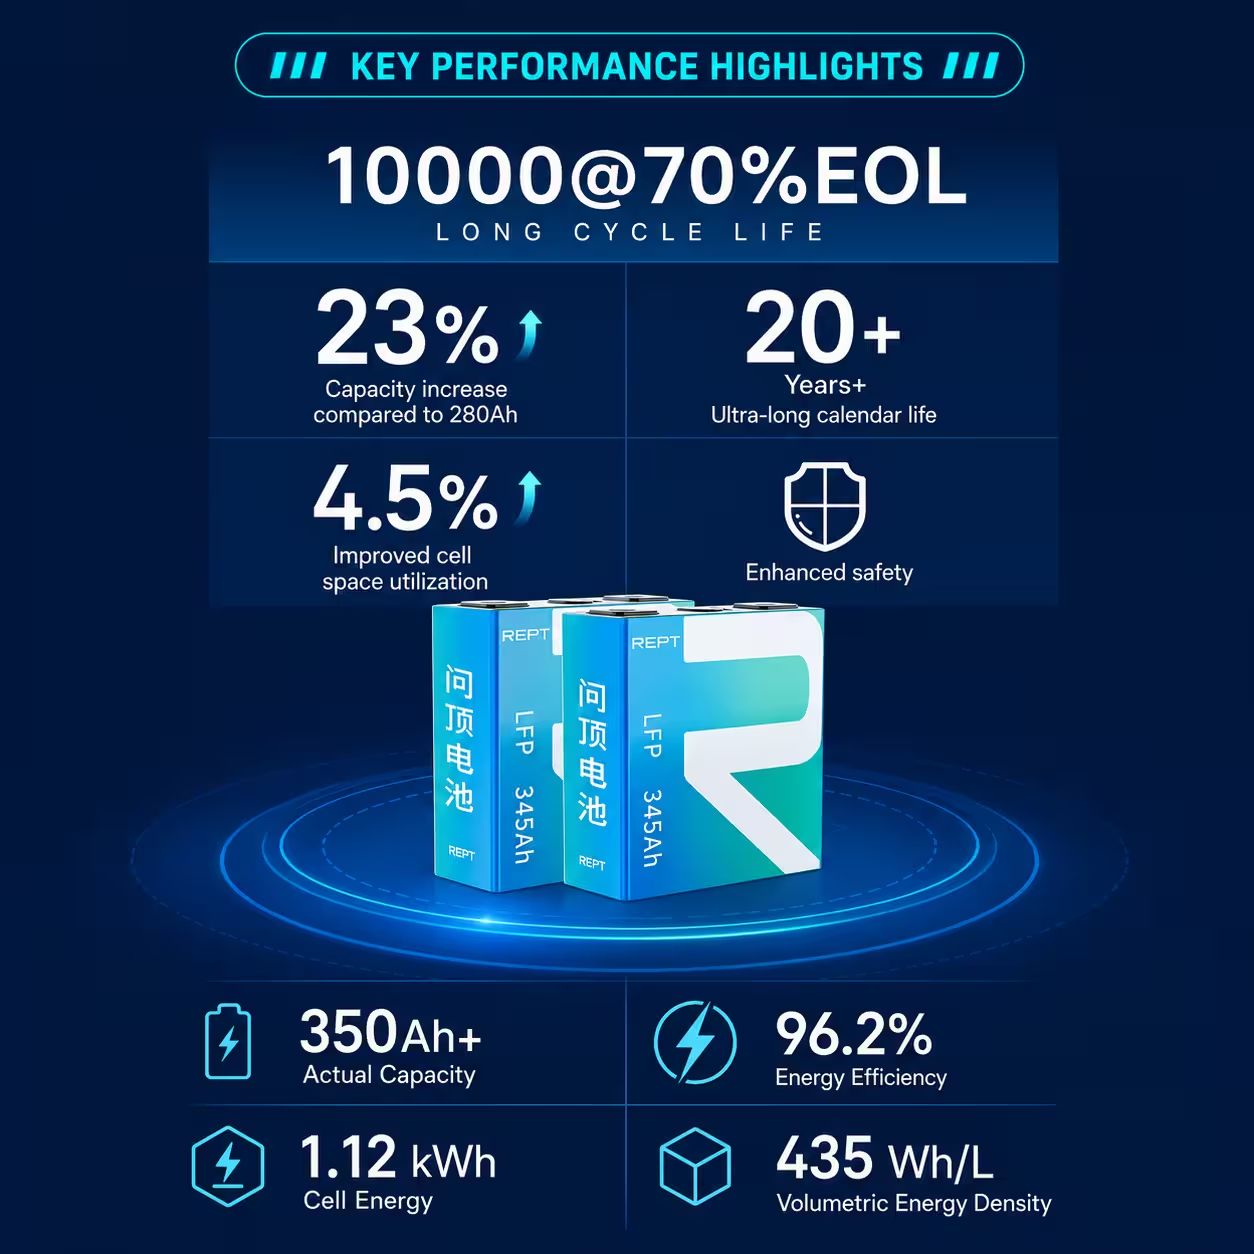
Choose the REPT 345Ah if you want maximum capacity per cell for a low-to-moderate power ESS system. It is ideal for large solar storage, off-grid battery banks, long-duration backup, and systems where the discharge current is relatively gentle. The REPT CB84 datasheet lists 345Ah, 3.2V, 1104Wh nominal energy, 0.25P standard charge/discharge, and 8000 cycles to 70% SOH at 25°C under 0.25P/0.25P cycling. (Shopline)


Comparison Table

CellNominal CapacityNominal EnergyBest Use CaseCycle RatingRate Character
EVE MB31314Ah~1005WhLong-life ESS, solar, residential/off-grid, commercial storage8000 cycles to 70% SOH under 25°C 0.5P/0.5P conditionsModerate power, 0.5P standard
EVE LF334334Ah~1075WhHigher-power DIY packs, RV, marine, mobile power, larger inverter systemsCommonly listed around 4000 cycles to 80% capacityHigher power; verify continuous vs pulse rating
REPT 345Ah CB84345Ah1104WhMaximum energy storage, low-rate ESS, large solar banks8000 cycles to 70% SOH at 25°C under 0.25P/0.25PConservative standard rate, 0.25P standard

The main lesson is simple: the biggest Ah number is not automatically the best cell. The correct choice depends on how much power the battery needs to deliver, how fast it needs to charge, how long you expect it to cycle, and how hard the system will be used.


Why Cell Variant Matters, Even Inside LFP

LFP cells share the same broad cathode chemistry, but that does not mean they have the same internal design. Manufacturers tune cells for different priorities: long cycle life, high energy density, high power output, low impedance, low swelling, lower cost, faster charging, or better thermal stability.

A cell optimized for ESS usually prioritizes long-term stability, lower side reactions, predictable swelling behavior, and long cycle/calendar life. A cell optimized for power applications may prioritize lower internal resistance, better high-current delivery, improved heat handling, and stronger pulse performance.

Battery formation also matters. Formation is not just a factory charge cycle; it activates the cell and helps establish protective interphase layers. Research reviews describe formation as a production step that can significantly affect capacity, power capability, lifetime, and safety, and note that material design, cell design, pressure, wetting, temperature, and process conditions all interact. (RSC Publishing)

Cycle life is affected by several degradation mechanisms, including loss of lithium inventory, loss of active material, impedance growth, SEI growth, lithium plating, and electrode particle damage. These mechanisms do not occur equally in every cell design, which is why two LFP cells can have very different cycle ratings and current limits. (RSC Publishing)


Cell 1: EVE MB31 314Ah

The EVE MB31 is the best choice for customers who want a proven, long-life energy storage cell rather than the highest possible current output.

It is a 314Ah, 3.2V prismatic LFP cell designed around ESS applications. EVE lists the MB31 as a commercial, industrial, utility, telecom, and residential ESS cell, with 0.5P/0.5P standard charge/discharge power. (evemall.eu)

The MB31’s headline strength is its cycle-life positioning. EVE’s product page describes the MB31 as “up to 8000 cycles; 70% SOH” under 25°C 0.5P/0.5P conditions. (evemall.eu)

This makes the MB31 a very strong option for:

  • Home solar storage
  • Off-grid battery banks
  • 48V server-rack style systems
  • Commercial and industrial ESS
  • Telecom backup
  • Long-duration daily cycling
  • Customers who value long service life over maximum current output

The MB31 is not necessarily the best cell for every high-current application. Its 0.5P rating is perfectly suitable for many ESS systems, but if someone wants a small 12V pack running a large inverter, or a high-power mobile application with big surge loads, the LF334 may be the better match.

MB31 in plain English

The MB31 is the “long-life ESS workhorse.” It is the cell to choose when the customer wants a dependable battery bank that cycles every day without being pushed hard. It is not the most aggressive power cell, but that is exactly why it makes sense for many solar and storage systems.


Cell 2: EVE LF334 334Ah

The EVE LF334 is the higher-capacity, higher-power option. It gives more Ah than the MB31 and is better suited to systems where current delivery matters.

Public LF334 listings describe it as a 334Ah LiFePO4 cell with approximately 1075Wh nominal energy, and some listings show real-world batch averages above the nominal rating. One listing describes 334Ah nominal capacity, 3.22V nominal voltage, and 1075.48Wh nominal energy. (LiFePo4 Australia)

The LF334 is often discussed as a stronger power cell than the MB31. Public listings show maximum discharge capability up to 3C, while also listing 4000 cycles to 80% capacity. (NKON)

However, this is where the wording matters. Some public information describes standard discharge as 0.5C and maximum instantaneous discharge as up to 3C for 30 seconds. (LiFePo4 Australia)

That means LF334 should be advertised carefully. It is fair to describe it as a higher-power cell, but unless the exact datasheet for your batch states that 2C or 3C is continuous, the safer wording is:

“Higher-power capable, with up to 3C pulse discharge depending on datasheet conditions.”

The LF334 is a good choice for:

  • High-power 12V builds
  • RV and caravan systems with large inverters
  • Marine systems
  • Mobile power systems
  • EV conversions or traction-style use cases
  • Large 24V and 48V inverter systems
  • Customers who want more capacity than MB31 and stronger current capability
  • Applications where 4000 cycles to 80% SOH is acceptable

LF334 in plain English

The LF334 is the “higher-output” option. It stores more energy than the MB31 and is better suited to customers who may run higher inverter loads or need stronger surge capability. The trade-off is that its commonly published cycle rating is lower than the MB31’s headline ESS cycle rating, and its high-current claims must be matched to the correct datasheet conditions.


Cell 3: REPT 345Ah CB84

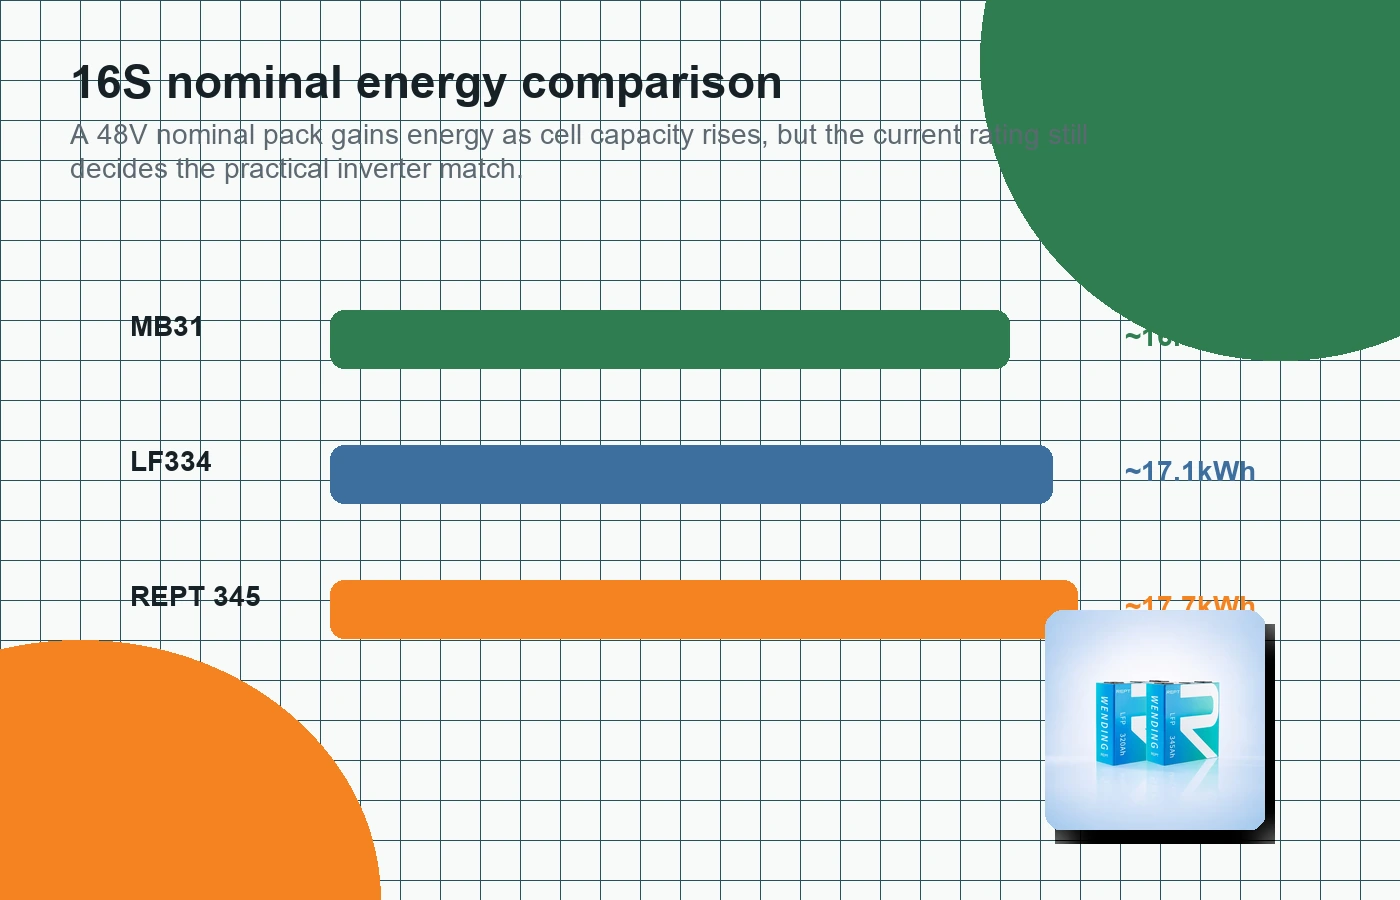
The REPT 345Ah is the largest-capacity cell in this comparison. At 345Ah and 3.2V, it stores approximately 1104Wh per cell, which means a 16-cell 48V nominal pack is around 17.7kWh before system losses. The REPT datasheet lists 345Ah nominal capacity, 3.2V nominal voltage, and 1104Wh nominal energy. (Shopline)

Its main attraction is capacity. For customers building a large energy storage bank, the REPT 345Ah can reduce the number of parallel strings needed compared with lower-capacity cells.

The important limitation is current rate. The datasheet lists 0.25P standard charging and 0.25P standard discharging. It also shows 8000 cycles to 70% SOH at 25°C under 0.25P/0.25P cycling. (Shopline)

Some REPT datasheet information also shows 0.5P maximum continuous charge/discharge power at 25°C, but for conservative customer guidance, 0.25P should be treated as the standard design point unless the supplied datasheet, warranty, BMS, busbars, compression fixture, and thermal design all support higher operation. (Shopline)

The REPT 345Ah is a good choice for:

  • Large off-grid solar banks
  • Home ESS with moderate inverter loads
  • Long-duration backup systems
  • Energy-focused builds rather than power-focused builds
  • Customers who want maximum Ah per cell
  • Systems designed around lower C-rate operation
  • Parallel battery banks where current is shared across multiple strings

It is not the best choice for a single-string high-current system. For example, a single 16S REPT 345Ah pack at 0.25P is roughly a 4.4kW-class standard-rate battery. That can be excellent for gentle ESS operation, but it is not ideal for a customer expecting one battery string to support a large inverter continuously at high load.

REPT 345Ah in plain English

The REPT 345Ah is the “big capacity, gentle discharge” option. It is excellent when the goal is maximum stored energy, but it should not be chosen purely because it has the highest Ah rating. It is best when the system is designed around lower current per cell.


Power Comparison: Why Ah Is Not Everything

A common mistake is comparing only Ah:

  • MB31: 314Ah
  • LF334: 334Ah
  • REPT: 345Ah

On capacity alone, the REPT looks like the winner. But battery selection is not only about capacity. It is also about how much power the cell can safely deliver.

Approximate single-string 16S figures:

Cell16S Nominal EnergyConservative Standard Power
EVE MB31 314Ah~16.1kWh~8.0kW at 0.5P
EVE LF334 334Ah~17.1–17.2kWhDepends on datasheet; potentially much higher than MB31 if 1C continuous is allowed
REPT 345Ah~17.7kWh~4.4kW at 0.25P standard

This is why a 345Ah cell can be the best choice for a large low-rate storage bank, while a 334Ah cell can be the better choice for a high-power inverter build.

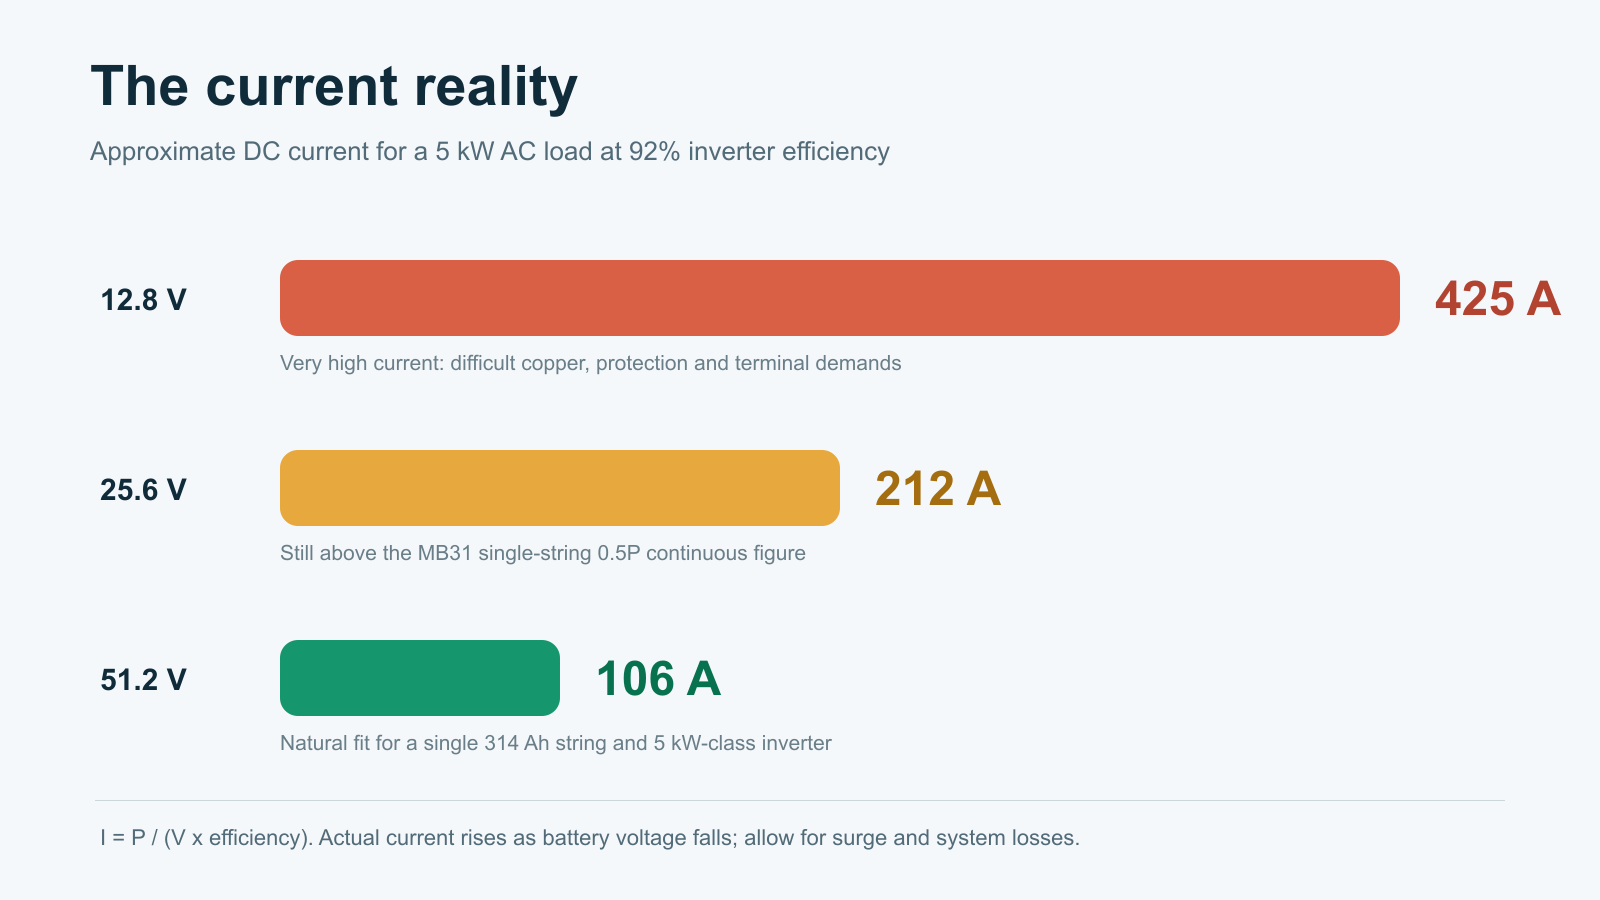
For 12V systems, this matters even more. A 3000W inverter on a 12V battery can draw well over 230A before losses. That is a heavy current load for a single string. In that type of system, LF334 may make more sense than REPT 345Ah, or the customer may need parallel strings.

For 48V systems, the current is much lower for the same power, so MB31 and REPT become more practical. But even then, a 5kW inverter can still exceed the conservative 0.25P standard rate of a single REPT string once inverter losses and surge are considered.


Cycle Life: Do Not Compare the Numbers Blindly

Cycle-life ratings are only meaningful when the test conditions are known.

A cell rated for 8000 cycles to 70% SOH is not directly comparable with a cell rated for 4000 cycles to 80% SOH. The endpoint is different. The current rate may be different. The temperature may be different. The compression force may be different. The charge/discharge profile may be different.

That matters because cycle life depends heavily on how the cell is used. Higher current, higher temperature, poor compression, charging at low temperature, repeated high SOC storage, poor balancing, and weak thermal management can all reduce practical service life.

For this comparison:

  • The MB31 is the best long-cycle ESS option.
  • The LF334 is the best higher-power option.
  • The REPT 345Ah is the best high-capacity low-rate storage option.

There is no single “best” cell. There is only the best cell for the application.


Which Cell Should You Buy?

Choose EVE MB31 if you want long-life solar storage

The MB31 is the best general recommendation for most home ESS and off-grid users. It has strong cycle-life positioning, good current capability for normal storage use, and a well-established application fit.

Best for:

  • Daily solar cycling
  • Residential ESS
  • Off-grid homes
  • 48V battery banks
  • Long service life
  • Moderate inverter loads
  • Customers who want a proven ESS cell

Avoid it if:

  • You need very high current from a small pack
  • You are building a high-power mobile system
  • You need the absolute highest Ah per cell

Choose EVE LF334 if you need more power

The LF334 is the better fit when the system may demand high current. It is especially attractive for mobile applications, RVs, marine builds, and high-output inverter systems where a conservative ESS cell may feel limiting.

Best for:

  • High-power DIY builds
  • Large 12V systems
  • RV and marine inverters
  • Mobile work vans
  • Fast charge/discharge applications
  • Customers who want more punch than MB31
  • Applications where 4000 cycles to 80% SOH is acceptable

Avoid it if:

  • The customer only cares about maximum cycle life
  • The system is low-power and does not need the extra output capability
  • The datasheet does not confirm the continuous current rating being advertised

Choose REPT 345Ah if you want maximum capacity

The REPT 345Ah is best when the goal is a large, efficient, low-rate storage bank. It is an excellent choice for customers who want more kWh and are not trying to pull huge current from one string.

Best for:

  • Large solar storage
  • Off-grid battery banks
  • Low-to-moderate current ESS
  • Long-duration backup
  • Parallel battery systems
  • Customers who want maximum Ah per cell

Avoid it if:

  • You need high current from one string
  • You are running a large inverter from a small 12V or 24V pack
  • You want the highest power capability per cell
  • The system cannot be designed around the conservative 0.25P standard rate

Final Verdict

The EVE MB31 is the best all-round long-life ESS cell. It is the one to choose for most customers who want reliable solar storage and long daily cycling.

The EVE LF334 is the best high-power choice. It gives more capacity than the MB31 and is better suited to demanding inverter loads, mobile applications, and customers who need stronger charge/discharge capability.

The REPT 345Ah is the best high-capacity storage choice. It gives the most energy per cell, but it should be used in systems designed around lower current per cell.

The correct question is not “which cell has the biggest Ah rating?” The correct question is:

How much energy do you need, how much power do you need, and how hard will the battery be cycled?

Once you answer that, the right cell becomes much clearer.

Sources

  1. MB31-Prismatic LiFePO4 Battery Cells-EVE Energy
  2. Eve LF334 – 334Ah – LiFePO4 3.2V – Single stud – Grade A-
  3. 2MW/2.65MWh厢式储能系统
  4. Lithium-ion battery cell formation: status and future directions towards a knowledge-based process design – Energy & Environmental Science (RSC Publishing) DOI:10.1039/D3EE03559J
  5. Lithium-ion battery degradation: how to model it – Physical Chemistry Chemical Physics (RSC Publishing) DOI:10.1039/D2CP00417H
  6. EVE LF334 LITHIUM IRON PHOSPHASE IEC 62619 MSDS UN38.3 » LiFePo4 Australia
  7. EVE LF334 LITHIUM IRON PHOSPHASE IEC 62619 MSDS UN38.3 » LiFePo4 Australia
Blog
Can a Non-CEC Inverter Be Connected to the Australian Grid?

Australian grid connection guide

Can a non-CEC inverter be connected to the Australian grid?

For a normal grid-connected solar or battery system, you should assume the answer is no unless your electricity distributor gives written approval. In practice, Australian DNSPs usually require grid-connected inverters to be on the Clean Energy Council approved inverter list.

Grid-connected systems CEC inverter list DNSP approval Off-grid exception
General information only: this article is not legal or electrical advice. Rules change, and the final answer depends on your inverter model, state, distributor, connection type, export control requirements and installation design. Always confirm with the local DNSP and a suitably licensed electrician before buying equipment.

Grid-parallel

If the inverter can operate in parallel with the distribution grid, the distributor normally wants a CEC-listed inverter and the correct AS/NZS 4777.2 settings.

Off-grid

A true off-grid system that cannot parallel with the grid is different. CEC grid-listing may not be the same issue, but electrical safety and installation rules still apply.

Zero export

Zero export does not automatically make a system “not grid connected”. If it is connected in parallel with the grid, the DNSP can still require approval and compliant equipment.

The simple answer

The Clean Energy Council does not personally approve your grid connection. Your local electricity distributor, usually called the DNSP, controls the connection process.

However, the CEC approved inverter list is the main product list used across Australia to check whether an inverter has evidence of compliance with the relevant standards. That is why installers, retailers, rebate programs and distributor portals care so much about whether the inverter is CEC-listed.

So while the technical authority is the DNSP, the practical answer is simple: if the inverter is not on the CEC approved inverter list, most normal grid connection applications will be difficult or impossible.

Why “CEC approved” matters

AreaWhy it mattersWhat to check
DNSP connection approvalThe distributor needs to know the inverter can behave safely and correctly on the grid.CEC listing, AS/NZS 4777.2 compliance, regional settings and DNSP-specific conditions.
STCs and rebatesFinancial incentives often require approved components and compliant installation.Clean Energy Regulator and relevant state or rebate scheme rules.
Installer sign-offA licensed installer may not be willing or able to sign off a non-listed inverter for grid connection.Exact equipment model, wiring arrangement, commissioning requirements and certificates.
Future serviceabilityUnsupported or unlisted equipment can become a problem during warranty, inspections, insurance or sale of the property.Local support, documentation, firmware, distributor approval and compliance evidence.

What about a Victron Multi RS Solar?

A common example is the Victron Multi RS Solar. It is a capable product for the right application, especially off-grid or specialist systems, but that does not automatically mean it is suitable for Australian grid-parallel connection.

If the exact model is not on the CEC approved inverter list for grid connection, do not assume it can be connected to the grid. Treat it as an off-grid or specialist product unless the local DNSP and a qualified installer confirm otherwise in writing.

Important distinction: a high-quality inverter can still be the wrong product for a grid-connected Australian installation if it does not have the required Australian grid certification, listing or distributor approval.

When a non-CEC inverter may still be useful

  • True off-grid systems with no grid-parallel operation.
  • Generator-backed systems where the inverter is not connected to the distribution grid.
  • Specialist engineered systems with formal DNSP approval.
  • Research, testing or temporary setups that are not connected to the public grid.

When to avoid it

  • You want STCs, rebates or a standard grid application.
  • The system will export or can operate in parallel with the grid.
  • The installer cannot select the inverter in the DNSP portal.
  • You need a simple, insurable, supportable home battery installation.

If you still want to try

Some distributors may have a written-approval pathway for unusual equipment, but that is not the same as a general permission to install anything. You would normally need strong evidence, and approval should be sought before purchase.

  • Ask the DNSP whether they will assess a CEC-unlisted inverter proposal.
  • Ask what certification evidence they require, including AS/NZS 4777.2 evidence.
  • Confirm whether CSIP-AUS, dynamic export, emergency backstop or utility-server communication applies.
  • Get the answer in writing before spending money on the inverter.
  • Do not rely on “zero export” as a workaround unless the DNSP confirms the design is acceptable.

Frequently asked questions

Is the CEC the same as the grid connection authority?

No. The DNSP controls the grid connection process. The CEC approved inverter list is the practical product list used to show an inverter meets relevant standards and is acceptable for many connection and incentive processes.

Can I use a non-CEC inverter if I set it to zero export?

Not automatically. If the inverter is connected in parallel with the grid, your distributor may still treat it as a grid-connected inverter energy system and require approval, compliant settings and approved equipment.

Can I use a non-CEC inverter off-grid?

Possibly, if it is a true off-grid system and installed safely. That is a different question from connecting it to the public distribution grid. Electrical safety, battery standards, isolation, generator integration and local rules still matter.

Will I lose STCs or rebates with a non-CEC inverter?

You may. Many incentive pathways require approved components and compliant installation. Confirm with the Clean Energy Regulator, the rebate program and your installer before assuming the system qualifies.

Useful official references

Want a battery or inverter system that can actually be approved?

Tell us what you are trying to build. We can help separate off-grid equipment, grid-approved inverter choices, DNSP limits and rebate eligibility before you buy the wrong hardware.

Start a system enquiry
News Sodium Ion
Why Natron Energy Collapsed

What happens when mass manufacturing and scale disrupts new and sometimes better technology for niche applications

Inside the $1.4B Battery Dream That Died Overnight

Just one year after announcing a $1.4 billion sodium-ion battery gigafactory that promised 1,000 high-wage jobs in rural North Carolina, Natron Energy is gone.

On September 4, 2025, the 13-year-old California startup shut down all operations, laid off its entire workforce of ~95 employees, and abandoned plans for what was to be one of the largest sodium baed clean-energy investments in the USA

The news hit like a shockwave — not just for the workers in Michigan and California, but for state officials who had already approved $56.3 million in incentives (none of which were paid).

So what went wrong?

In this deep-dive investigation, we uncover the real reasons behind Natron’s collapse — from frozen investor payments and policy shifts to manufacturing economics and a fatal mismatch between innovation and market timing.


The Final Days: A Desperate Search for Cash

According to internal documents and interviews, Natron’s board made the final call on August 27, 2025: fundraising efforts had failed.

“Natron’s efforts to raise sufficient new funding were unsuccessful, having failed to result in sufficient funding proceeds to cover the required additional working capital and operational expenses.”
Elizabeth Shober, Head of Team & Talent, in letter to Michigan labor officials

The company had been in survival mode for months:

  • Existing investors — including Chevron, United Airlines Ventures, and Khosla Venturesfroze scheduled payments starting in June 2025.
  • A Series B round was pitched but never closed.
  • Debt financing talks collapsed.
  • Even a last-ditch asset sale (via California advisory firm Sherwood Partners) came too late.

By late August, Natron had only $25 million USD in booked orders — mostly for data center backup power — but couldn’t fulfill them. Certification delays (UL 1973) and the looming 60-day WARN Act layoff notice created a death spiral:
no delivery → no revenue → no investor confidence → no lifeline.

CEO Colin Wessells stepped down in December 2024 — citing the “all-consuming” burden of fundraising. His departure was an early warning sign.


The Cost Conundrum: BOM vs. Reality

Natron’s sodium-ion batteries were built on a compelling promise: cheaper, safer, more sustainable than lithium-ion.

Using Prussian blue electrodes and abundant materials like sodium, aluminum, iron, and manganese, the company avoided lithium, cobalt, and nickel entirely. No rare earths. No geopolitical risk.

ComponentNatron (Sodium-Ion)Lithium-Ion (LFP)
CathodePrussian blue (Fe, Mn, Na)Lithium iron phosphate
AnodeHard carbonGraphite
ElectrolyteSodium salt in organic solventLithium salt
Projected BOM Cost (2030)$10/kWh (grossly exaggerated)$40–60/kWh

But here’s the catch: low energy density (~50 Wh/L vs. 300 Wh/L for Li-ion) meant Natron’s batteries were only viable for power-dense applications like grid or data centre stabilization and or possibly fast-charging stations — not EVs or consumer devices. The reality was, they were heavy, and huge. And over time, the price of Lithium based batteries fell so quickly, that most technology has been put out of business.

China dominates battery manufacturing, overnight in december 2024, CATL announced a 50% price drop for LFP batteries at the cell level. From around $100 per kWh to $50 per kWh. This price is wholesale, without any retail margins, so its not the true cost, but it gives you an idea, of the power they can weild, this also affected many other chinese companies, such as Gotion, but this decision also completely wiped out all the planned factories across the globe, some in the USA, and some in Australia who had been budgeting for $100 a kWh, they now had no future.

China is not messing around, this is a fight that without mega Billions of dollars, supply chains and the highest level of automation, the competiting countries have no chance of getting off the ground.

And while long-term BOM costs looked promising, scaling manufacturing was brutally expensive:

  • Retrofitting the Michigan plant cost $40 million.
  • The North Carolina gigafactory was budgeted at $1.4 billion40x the Michigan site’s capacity.
  • Upfront system costs were higher than Li-ion initially, with savings only over 50,000+ cycles.

Even with $35/kWh IRA tax credits, the math didn’t work without massive volume — and volume required capital Natron no longer had.


Market Timing: The Lithium Price Crash

In 2022, lithium carbonate hit $80,000/ton. Sodium-ion looked like the future.

By 2025? Under $10,000/ton. A 70%+ collapse.

Suddenly, lithium iron phosphate (LFP) batteries — already dominant in China — became cheaper than ever. Data centers and utilities asked: Why switch to an unproven chemistry?

Natron’s niche advantage evaporated.


The Full Breakdown: Why Natron Failed

FactorImpactOutcome
Frozen Investor PaymentsChevron, United, Khosla halted funds in June 2025Cash runway ended
Policy ShiftReduced federal support under Trump admin; ARPA-E grants stalledLost goodwill funding
Certification DelaysUL 1973 blocked $25M in ordersNo revenue to show investors
Lithium Price Crash70% drop eroded cost edgeCustomers stayed with LFP
High CapEx for Low-Density Tech$1.4B factory for power-focused batteriesToo risky without scale
China Dominance~100% of global sodium-ion capacityU.S. startups outgunned

What’s Next for Sodium-Ion?

Natron’s collapse is not the end of sodium-ion technology.

Experts like those at Mana Battery call it “very specific to Natron” — citing execution missteps, niche focus, and bad timing. Others, like Bedrock Materials and Peak Energy, are still advancing sodium-ion with smaller, grid-focused strategies.

China already has over 10 GWh of sodium-ion capacity online. The chemistry works. The market exists.

But Natron’s story is a sobering reminder: in clean energy, innovation alone isn’t enough. You need capital, timing, policy, and customers — all aligned.

North Carolina’s Kingsboro megasite is back on the market.
State officials call it “one of the top megasites in the country.”
This was its second major flop in seven years.


Sources & Further Reading

  • WRAL News – Original closure announcement
  • Battery industry reports (2024–2025): Mana Battery, BloombergNEF, ARPA-E
  • Internal Natron documents via Michigan WARN Act filings
  • Interviews with former employees and industry analysts

News Blog
Differences in Internal Resistance between LFP manufacturers and cell models

Overview of LFP Prismatic 314Ah Cells

Lithium Iron Phosphate (LiFePO4 or LFP) prismatic cells in the ~314Ah capacity range are popular for energy storage systems (ESS), electric vehicles (EVs), and solar applications due to their safety, long cycle life (often 4,000–8,000+ cycles), and stable voltage plateau around 3.2V. These cells share similar dimensions (typically ~174mm x 72mm x 207mm) and chemistry but differ in design optimizations, leading to variations in performance metrics like internal resistance (IR).

Observed IR values (EVE MB31 ~0.18 mΩ, LF304 ~0.15 mΩ, REPT ~0.23 mΩ) align closely with manufacturer specifications and real-world testing. Note that IR is typically measured as AC impedance at 1 kHz (per industry standards) and can vary ±0.05 mΩ due to factors like temperature, state of charge (SOC ~30–50% for fresh cells), and measurement tools. Lower IR generally means better efficiency (less heat, higher discharge rates), but all these values are low for 314Ah LFP cells, indicating high-quality Grade A (or HSEV/EV-grade) products.

Confirmed Internal Resistance Specs

Based on official datasheets and verified seller data:

Manufacturer/ModelNominal CapacityInitial IR (AC, 1 kHz)Typical Real-World RangeCycle Life (0.5C/0.5C)Key Notes
EVE MB31314Ah≤0.18 mΩ (±0.05 mΩ)0.16–0.23 mΩ≥8,000 cyclesNewer high-density evolution of EVE’s 304Ah line; optimized for ESS with low heat generation. Tested capacities often exceed 330Ah.
EVE LF304304Ah≤0.15 mΩ (±0.05 mΩ)0.14–0.20 mΩ≥4,000 cyclesOlder high-power model; slightly lower capacity but prioritized for EV/high-discharge apps. IR can appear lower due to thicker electrode coatings.
REPT (CB75/CB71)314Ah≤0.23 mΩ (±0.05 mΩ)0.20–0.25 mΩ≥8,000 cyclesFocuses on “Wending” tech for space efficiency; higher IR but excellent thermal stability and 95%+ efficiency at 0.5P discharge.

These values come from EVE and REPT official datasheets, with real-world ranges from independent tests (e.g., DIY solar forums and battery resellers). The LF304’s lower IR reflects its design for power delivery, while REPT’s slightly higher value trades off for enhanced safety and longevity in stationary storage.

Why Variations in Internal Resistance Between Manufacturers?

Internal resistance in LFP cells arises from ohmic (electrolyte/connector) and polarization (electrode/ion diffusion) components. While all LFP cells use the same base chemistry (LiFePO4 cathode, graphite anode, liquid electrolyte), manufacturers like EVE and REPT optimize differently, leading to IR differences of 0.03–0.08 mΩ. Here’s a breakdown of key factors:

  1. Electrode Design and Material Choices:
    • Particle Size and Coating Thickness: Finer cathode particles or thinner coatings (e.g., EVE LF304’s high-power focus) reduce ion diffusion paths, lowering polarization resistance (~0.10–0.15 mΩ contribution). REPT’s “double-high” solid-liquid interface uses coarser particles for stability, slightly raising IR but improving cycle life.
    • Tab Configuration: More/wider current collectors (tabs) shorten electron paths. EVE MB31 uses stacked/wound hybrids with more tabs, achieving ~0.18 mΩ. REPT’s top-to-bottom “Wending” tech maximizes space but can add ~0.05 mΩ due to longer internal paths.
  2. Manufacturing Processes and Quality Control:
    • Assembly Uniformity: Variations in electrode alignment, electrolyte filling, or welding introduce inconsistencies. EVE’s highly automated lines yield tighter IR tolerances (±0.05 mΩ), while REPT emphasizes safety testing, which may allow a broader range.
    • Grade and Sorting: All are Grade A, but “HSEV” (high-safety EV) variants (common for these) are sorted for low IR. Subtle batch differences (e.g., electrolyte additives for thermal runaway prevention) can shift IR by 10–20%.
  3. Optimization Trade-Offs for Application:
    • Power vs. Energy Focus: LF304 (EVE) targets EVs with high C-rates (up to 1C continuous), needing ultra-low IR for minimal voltage sag. MB31 balances ESS longevity. REPT prioritizes stationary storage, where higher IR is acceptable for better abuse tolerance (e.g., overcharge resistance up to 270°C).
    • Energy Density Enhancements: Higher-density cells (e.g., MB31’s 173 Wh/kg) pack more active material, potentially increasing resistance slightly if not offset by innovations like REPT’s 7%+ space utilization boost.
  4. Measurement and Environmental Factors:
    • Test Conditions: Specs use fresh cells at 25°C and ~30% SOC. Real measurements (e.g., your 0.23 mΩ for REPT) may vary with tools—use a 1 kHz AC meter for accuracy. Temperature swings (±10°C) can change IR by 20%.
    • Aging and Degradation: IR rises ~50–150% over life (faster in LFP than NMC), but your values suggest new cells.

Overall, these variations (20–50% relative difference) are normal and don’t indicate defects— they’re engineered for specific strengths. For ESS, REPT’s higher IR means ~2–5% more heat at 0.5C but superior safety. EVE’s lower IR suits high-draw apps like inverters.

Recommendations

  • Matching Cells: For packs, match IR within 0.05 mΩ to avoid imbalances (use a calibrated meter like YR1035+).
  • Testing: Discharge at 0.2C to verify capacity (>310Ah expected) and monitor IR over cycles.
  • Sources: Download full datasheets from EVE/REPT sites or resellers like GobelPower for curves. For comparisons, check ECO Teardown’s aggregated specs.

Conclusion

Not all LFP cells are made equally, they are optimised for slightly different applications. We choose the best balance and allow you to make a decision based on these factors.

In most cases, using EVE or REPT for the high majority of cases, will make little difference, but for small 12v inverter applications attached to a 3000w Inverter, EVE LF304 might be most suitable if you are looking for high power continuous applications, Either way its likely you will see thousands of cycles .

In reality, most people size their battery appropriately if budget allows, we would recommend 2 x 12v 314ah batteries for those looking to pull 3000w regularly, this might be for cooking, microwaves or even small Air conditioning systems.

News Blog
Who is Deye?

Who is Deye? And what makes them special?

Deye is a leading manufacturer of high quality renewable energy solutions, they really have taken the market by storm in the last 5 years in Australia. The products we absolutely love here in at LiFePO4 Australia is the range of SUN Hybrid Inverters. Starting at just 5000W single phase 48v LV right up to the 16kW single phase LV model which really is groundbreaking.

Deye also makes products for SunSynk and Sol-Ark, along with NoArk who has the products in Australia.

Origins, corporate structure & listing

Deye grew out of Ningbo Deye Technology, a diversified appliance and climate-tech manufacturer founded in 1990 in Ningbo, Zhejiang. In 2007 it spun up Ningbo Deye Inverter Technology to focus on PV power electronics and later energy storage (ESS).

What Deye builds: the product families

1) SUN-series hybrid inverters (residential & C&I)

  • Single-phase 48 V (LV): e.g., SUN-5-16K-SG0(x)LP1-AU variants
  • Three-phase 48 V (LV): SUN-5/6/8/10/12K-SG04LP3-AU for Australia
  • Three-phase high-voltage (HV): Various models from 5K up to 100K

Single Phase Hybrid LV (48v Battery)

Big Residential Hybrid LV Inverters

Three Phase Hybrid LV (48v Battery)

Batteries

  • Rack – IEC listed (good when no rebates are applicable
  • Stack – CEC approved (rebates)
  • Wall Mount CEC approved (rebates)

Recommended products

Deye is a vertically-integrated Chinese manufacturer that evolved from climate appliances into a full-stack PV-plus-storage supplier. The SUN-series hybrids earned a following by combining feature-dense controls (parallel/off-grid/AC-couple/genset support) with 48 V battery friendliness and region-specific compliance. For Australian projects in 2025, the critical checks are: current AS/NZS 4777.2 Amd 2 compliance, presence on CEC/CER-maintained approved lists, and battery-BMS compatibility per the latest Deye tables. That diligence preserves rebate eligibility, simplifies commissioning, and ensures the hardware behaves exactly as your design expects.

Who is Deye?

Worlds Largest Single Phase Low Voltage Hybrid Inverter

Blog
DEYE SUN-12K-SG02LP1-AU-AM3 vs SUN-12K-SG01LP1-AU

Here’s a side-by-side look at the key technical differences between the two 12 kW Deye hybrid inverters:
SUN-12K-SG02LP1-AU-AM3 vs SUN-12K-SG01LP1-AU

FeatureSUN-12K-SG02LP1-AU-AM3SUN-12K-SG01LP1-AU
Battery charge/discharge current250 A (max) Deye Inverter210 A (max) Deye Inverter
Max PV access power24 000 W Deye InverterDeye Inverter24 000 W Deye Inverter
Max DC input power18 000 W Deye Inverter18 000 W Deye Inverter
Continuous AC passthrough current60 A Deye Inverter100 A Deye Inverter
AC output rated current52.2 A Deye Inverter52.2 A Deye Inverter
MPPT efficiency> 99 % Deye Inverter99.90 % Deye Inverter
Max. efficiency (η<sub>max</sub>)97.6 % Deye Inverter97.6 % Deye Inverter
Weight35.6 kg Deye Inverter48 kg Deye Inverter
Dimensions (W×H×D)420×670×233 mm Deye Inverter464×763×282 mm Deye Inverter
Noise level< 45 dB Deye Inverter< 50 dB Deye Inverter
AC/DC topologyTransformerless / HF-transformer Deye InverterTransformerless / HF-transformer Deye Inverter
Protection & standardsIP65, AS/NZS 4777.2, IEC 62109-1/2 Deye InverterIP65, AS/NZS 4777.2, IEC 62109-1/2 Deye Inverter

What this means for you

  • Battery throughput: SG02 handles ~20 % higher charge/discharge current, so faster cycling if you need rapid charge/discharge (e.g. peak-shaving).
  • Physical footprint: SG02 is ~25 % lighter and ~30 mm shallower, making it easier to wall-mount or fit into compact enclosures.
  • Backup capability: SG01’s 100 A passthrough gives a heftier emergency load supply than SG02’s 60 A, so if you plan heavy critical loads during grid-out, SG01 has the edge.
  • Efficiency & performance: Both share the same peak efficiency and grid-compliance; SG01’s MPPT efficiency spec is stated slightly tighter (99.90 %) but in real-world use you’ll see both tracking very near 99 %.

Choose SUN-12K-SG02LP1-AU-AM3 if you prioritise higher battery current and a lighter, more compact unit; choose SUN-12K-SG01LP1-AU if you need maximum passthrough for backup loads and don’t mind the extra size/weight.

Blog Lithium Battery-school
How to Start a JK BMS (4-8S) for the First Time – 4S (12V) Setup

If the JK BMS is not turning on when first connected, follow these steps to troubleshoot and properly power it up.

1. Check the Wiring Connections

  • Ensure the balance leads are connected correctly
    • The B- lead should be connected to the main negative of the battery pack.
    • The balance wires must be connected in the correct sequence:
      • B0 (Black wire) → Main negative terminal of the first cell
      • B1 → Positive terminal of Cell 1
      • B2 → Positive terminal of Cell 2
      • B3 → Positive terminal of Cell 3
      • B4 → Main positive terminal of the battery pack

2. Verify Cell Voltages

  • Measure the voltage between each balance wire using a multimeter.
  • Ensure all cell voltages are within a reasonable range (typically 3.2V – 3.6V per cell).
  • If any cell voltage is missing or significantly different, the BMS may not power on.

3. Check the Main Power Connection

  • B- Wire (Main Negative): Ensure the thick B- wire is securely connected to the main negative of the battery pack.
  • P- Wire (Output Negative): This connects to the load/charger and should not be used for powering the BMS initially.

4. Manually Activate the BMS

  • Some JK BMS units require manual activation if they don’t turn on automatically.
    • Try plugging in a charger (even briefly) to the battery terminals to “wake up” the BMS.
    • Alternatively, hold down the power/reset button (if available) for 3-5 seconds.
    • If you dont have the power button, consider sourcing one

5. Check if the BMS is Drawing Current

  • Use a multimeter in DC current mode to check if any current is flowing through the BMS.
  • If the BMS is drawing zero current, it may indicate a wiring issue or a defective unit.

6. Test Communication with the App

  • Download the JK BMS App on a smartphone.
  • Turn on Bluetooth and try scanning for the device.
  • If the BMS does not appear, it is still off or not receiving power.

7. Inspect for Factory Sleep Mode

  • Some BMS units are shipped in a factory sleep mode, requiring a charger or an external power source to turn on.

8. Reset the BMS

  • If all else fails, disconnect all connections for 1-2 minutes, then reconnect everything carefully.

Final Check

  • Once the BMS powers on, verify that all cell voltages are detected correctly in the app.
  • If issues persist, check the BMS documentation or test with another BMS to rule out a faulty unit.

STILL NOT WORKING? Its probably in sleep mode

If the JK BMS is in sleep mode and does not have a power button, here are all possible ways to wake it up:


1. Connect a Charger to the Battery

  • Most common method: Connecting a charger to the battery terminals will usually wake up the BMS.
  • Plug a LiFePO4-compatible charger (or a power supply) into the battery’s main terminals (B+ and B-).
  • Even a brief connection (a few seconds) might be enough to turn the BMS on.

2. Connect a Charger to the Load Side (P+ and P-)

  • If charging via the battery terminals does not work, try connecting the charger to the load terminals (P+ and P-).
  • Some JK BMS models wake up when voltage is applied here.

3. Apply a Small Load Across P+ and P-

  • Some JK BMS units wake up when they detect a current draw.
  • Connect a small 12V load (e.g., a 12V light bulb or small resistor) across P+ and P- for a few seconds.

4. Jumpstart the BMS Using a Resistor or Wire

  • Take a resistor (~1kΩ – 10kΩ, 0.5W or higher) or a jumper wire and temporarily connect:
    • B+ (battery positive) to P+ (load positive)
    • B- (battery negative) to P- (load negative)
  • This creates a tiny voltage differential, which can wake the BMS up.

5. Disconnect and Reconnect the Balance Leads

  • Sometimes, disconnecting and then reconnecting the balance leads (B0-B4) in the correct order can trigger the BMS to power on.
  • Steps:
    1. Disconnect the balance connector from the BMS.
    2. Wait 1-2 minutes.
    3. Reconnect it in the correct sequence (B0 → B1 → B2 → B3 → B4).

6. Use a Bench Power Supply to Apply Voltage to B+ and B-

  • If the BMS is completely unresponsive, try applying a small amount of voltage from a bench power supply.
  • Set the power supply to 12-14V, and briefly connect it to B+ and B-.
  • This simulates a charger and can often wake up the BMS.

7. Check for a Reset Pin on the BMS Board

  • Some JK BMS units have an internal reset pin or pads that, when shorted for a second, will wake the unit.
  • If comfortable opening the BMS case, check for labeled pads (like RST or SW) and try shorting them momentarily.

Final Step: Replace the BMS

If none of these methods work, the BMS might be defective or damaged. Testing with another BMS will confirm whether the issue is with the battery or the unit itself.

Lithium Battery-school EV Engineering
Understanding Why Limiting Charging Rates Extends the Lifespan of Lithium Iron Phosphate (LFP) Batteries

Understanding Why Limiting Charging Rates Extends the Lifespan of Lithium Iron Phosphate (LFP) Batteries

As electric vehicle (EV) and energy storage enthusiasts continue exploring the best lithium-ion battery technologies, Lithium Iron Phosphate (LFP) has emerged as one of the most reliable choices. Known for its stability, high safety profile, and impressive cycle life, LFP has become the preferred option for many EV manufacturers, including Tesla, and is widely used in off-grid energy storage solutions. However, while LFP cells excel in durability, there’s a key factor to keep in mind for achieving optimal performance and longevity: limiting the charging rate.

Recent research on the LFP battery cells from a Tesla Model 3 has shed light on the importance of controlled charging. The study revealed that even high-quality LFP batteries experience significant wear and reduced lifespan when charged at rates exceeding 0.5C. By limiting the charging rate to 0.5C or less, these batteries can last significantly longer, providing multiple times the lifespan of those charged at higher rates. This article delves into these findings, explaining why lower charging rates are crucial for extending the life of your LFP batteries.

https://ars.els-cdn.com/content/image/1-s2.0-S001346862301513X-gr1.jpg

Cell shows is a 161.5 Ah prismatic flat wound hardcase cell from a state-of-the-art Tesla Model 3 in 2021-2023+ Chinese made Long Range version. Australian Long range RWD.

What Does “0.5C Charging Rate” Mean?

Before diving into the research findings, let’s clarify what the term “0.5C” means in the context of battery charging. The “C-rate” refers to the rate at which a battery is charged or discharged relative to its capacity. A 1C rate would mean charging a battery at a current that would fully charge it in one hour. A 0.5C rate, in turn, means charging it at half that current, or over two hours. Therefore, for a 100Ah battery, a 0.5C rate would be a 50A current.

The Study’s Findings: Why 0.5C is the Ideal Limit for LFP Batteries

The in-depth study of Tesla’s prismatic LFP battery cells showed that the battery’s performance and lifespan were significantly influenced by charging rates. Here’s a summary of the key findings:

  1. Increased Degradation at Higher C-Rates: The study found that at charging rates higher than 0.5C, lithium plating—a process where lithium ions accumulate unevenly on the anode—was more likely to occur. This plating can result in a range of performance issues, including reduced capacity, increased internal resistance, and even the risk of short circuits.
  2. Extended Lifespan with Lower Rates: When the battery was charged at 0.5C or lower, there was a noticeable reduction in wear and tear, significantly extending the overall lifespan of the cell. For users in the EV and solar storage markets, this insight underscores the value of slower, steady charging cycles. Slower charging reduces strain on the battery’s materials, preventing chemical and mechanical degradation that shortens its life.
  3. Why Lower Charging Rates Matter: Lower rates help avoid lithium plating, which tends to happen when the anode can’t absorb lithium ions quickly enough, leading to uneven distribution and increased risk of failure. By charging at a rate that allows for a uniform distribution of lithium ions, the battery retains its capacity and efficiency for longer.

The Case for Lower Charging Rates in Everyday Applications

For EV owners, energy storage users, and anyone relying on LFP batteries, these findings emphasize the importance of charging at a controlled rate. Charging at 0.5C or less not only maximizes battery lifespan but also enhances long-term energy efficiency. Let’s look at how this plays out in practical scenarios:

  • EV Charging: While some high-end EVs are capable of ultra-fast charging, LFP batteries used in these vehicles often limit charging speeds to avoid accelerated wear. Tesla, for example, carefully controls the charging rates in its vehicles equipped with LFP packs, balancing quick charging with long-term durability. For individual users, this means that opting for slower home-charging setups can actually help extend the life of their vehicle’s battery.
  • Solar and Off-Grid Energy Storage: In solar storage applications, battery health is critical for reliability and long-term cost savings. Charging at rates below 0.5C not only optimizes the lifespan of LFP cells but also ensures consistent performance over years, allowing off-grid users to get the most out of their investment. Since off-grid storage systems are typically designed to cycle batteries daily, maximizing the number of cycles through careful charging can make a significant difference.

How Lower Charging Rates Affect Battery Lifespan

The benefits of lower charging rates are especially apparent when considering the relationship between charging rate and battery cycle life. Studies have shown that LFP batteries can achieve thousands of cycles—up to 10,000 or more—when charged and discharged at a 0.5C rate or lower. In contrast, higher charging rates significantly reduce the number of cycles before the battery’s capacity begins to degrade. For example, charging at a rate of 1C or more can lead to premature aging, resulting in a battery that may last only a few thousand cycles.

A simplified way to look at this is that reducing the charging rate reduces stress on the battery, which keeps it in a healthier state longer. Each charge cycle at a controlled rate is a gentler cycle, allowing the battery materials to hold up over time. This means less frequent replacements, lower maintenance costs, and better long-term performance.

Understanding the Trade-Offs: Speed vs. Longevity

While faster charging can be convenient, especially in situations where quick turnaround is needed, it comes at the cost of lifespan. Here’s a quick comparison of the trade-offs:

Charging RateLifespan ImpactBest Use Cases
>1CSignificantly ReducedQuick charging needs, emergency situations
0.5COptimal LongevityRoutine EV charging, solar energy storage, daily cycling
<0.5CMaximum LifespanOff-grid storage, backup power systems where longevity is prioritized

Conclusion: Extending Your LFP Battery’s Lifespan Through Controlled Charging

For those seeking reliable, long-lasting LFP battery performance, charging at or below 0.5C is essential. Whether for an EV, solar storage system, or other energy solution, following this guideline can dramatically extend the lifespan and overall efficiency of your batteries.

In today’s fast-paced world, it’s tempting to charge everything as quickly as possible, but with LFP batteries, patience truly pays off. Taking a steady approach to charging can mean the difference between a battery that lasts years and one that requires early replacement. By embracing lower charging rates, we can get the most out of these resilient LFP batteries—optimizing performance, reducing environmental impact, and ultimately saving on costs in the long run.

Sources


https://www.sciencedirect.com/science/article/pii/S001346862301513X

https://www.linkedin.com/pulse/battery-disassembly-characterization-power-square-case-lfp-link-sun-cnx4c?trk=public_post_feed-article-content

X